
Getting senior buy-in for your directors’ and officers’ insurance strategy can be challenging.
Demonstrate the levels of D&O protection you’re recommending, and the efficacy of that expenditure, represent the best choice with D&O Quantified.
Substantiate insurance purchase strategy for your directors’ and officers’ (D&O) insurance with direct access to predictive modeling, customizable, risk-adjusted benchmarking, and compelling reports.
Getting senior buy-in for your directors’ and officers’ insurance strategy can be challenging.
Demonstrate the levels of D&O protection you’re recommending, and the efficacy of that expenditure, represent the best choice with D&O Quantified.
Discover a better way to evaluate your D&O exposure and loss potential with D&O Quantified.
Our global predictive modeling technology combines powerful risk quantification with direct access to customizable risk-adjusted benchmarking to help you both optimize and validate your D&O insurance strategy.
D&O Quantified helps you derive more value from your D&O insurance by enabling you to:
D&O Quantified gives you the clarity and certainty you and your directors need.
Calculate and communicate the trade-offs between the costs, limits and levels of D&O risk with our innovative and interactive platform, D&O Quantified.
You can respond to your board’s enquiries by testing alternative strategies in real-time with dynamic and customizable technology, providing quick answers to questions. Questions like:
D&O Quantified gives you answers in clear, compelling and concise reports, designed to support easier D&O strategy conversations between risk professionals and business leaders.
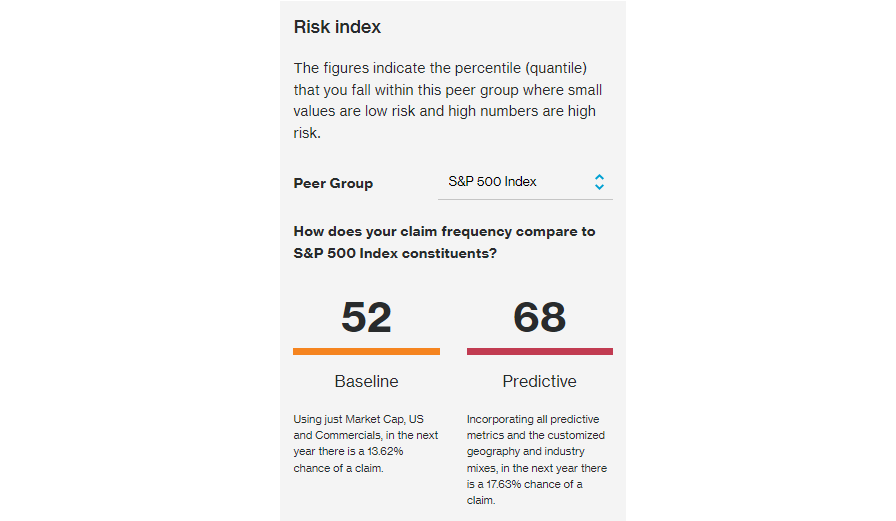
D&O Quantified puts you in control of peer benchmarking data. Set your own parameters across industry, market cap, exchange, and time period to build relevant comparisons that align with your business strategy as it evolves.
The market capitalization of your firm changes every day and D&O risk fluctuates daily and migrates significantly based on the exposed shareholder value. Use real-time analytics to monitor this everchanging risk keeping the board abreast of these material changes to your risk profile and strategies being implemented to protect the board. D&O Quantified puts you in control of the insights that drive better D&O return on investment.
Traditional benchmarking tells you what limits peers are buying—but not whether those limits are actually sufficient. Without accounting for differences in risk, the numbers are only telling part of the story.
D&O Quantified brings critical context to peer benchmarking.
Risk-adjusted benchmarking goes beyond limits and retentions, providing benchmarks for limit adequacy – how sufficient your peers’ limits are to cover their modeled loss exposure. This limit adequacy is then translated into coverage amounts that are relative to your risk profile.
So instead of saying that at the 75th percentile peers buy $100M in limit, you can say:
At the 75th percentile, peers buy limits sufficient to cover 98.5% of their projected D&O losses. To reach that same protection level, based on our risk profile, we would need $137M in coverage.
This approach puts benchmarking into context, helping you assess coverage needs based on the risk you actually face.
D&O Quantified is designed for publicly traded companies of all sizes and in all geographies.
This tool is not designed to evaluate smaller local D&O policies required for regulatory reasons. Our Employment Practices Quantified model can assess D&O loss potential and evaluate insurance for privately held and nonprofit organizations.
Discover better ways to evaluate your D&O exposure and loss potential today. Get in touch with one of our Risk and Analytics quantification specialists to learn more.
WTW hopes you found the general information provided here informative and helpful. The information contained herein is not intended to constitute legal or other professional advice and should not be relied upon in lieu of consultation with your own legal advisors. In the event you would like more information regarding your insurance coverage, please do not hesitate to reach out to us. In North America, WTW offers insurance products through licensed entities, including Willis Towers Watson Northeast, Inc. (in the United States) and Willis Canada Inc. (in Canada).


