

| Coverage | Trend | Range |
|---|---|---|
| Single carrier programs |  |
-5% to -15% |
| Shared and layered programs | |
-15% to -25% |
Key takeaways
- Q2 2026 rates fell 14.5% (shared/layered -23.41%, single carrier -8.42%), trending toward 2019 levels as the 2018-24 hard market reverses.
- H1 2026 insured CAT losses hit $42 billion, the lowest first half since 2020, but hurricanes remain a key wildcard.
- Treaty reinsurance softened at every 2026 renewal date, reinforcing abundant primary market capacity.
- WTW's Data and Innovation Suite (Gemini, Client Edge) and Data Center industry expertise continue to differentiate client outcomes.
Softening market
Downward pressure on property renewal rates continues to build across most segments. WTW's Large and Complex property portfolio saw average composite Q2 2026 renewal rates decline 14.5%, compared with 8.4% in Q2 2025. The effect is most pronounced on shared and layered programs, which averaged reductions of 23.41% in Q2 2026 (versus 14.57% a year earlier) on placements with five or more carriers. Single carrier programs also saw increased compression, averaging 8.42% decreases versus 3.77% a year earlier. Insurers are increasingly willing to enhance terms, conditions, deductibles and wordings as competition intensifies.
The market trajectory has clearly reversed from the challenging period spanning Q1 2018 through Q1 2024. WTW's proprietary benchmarking shows the large and complex property market ended 2025 at risk-adjusted rates roughly equivalent to 2022 levels, and Q1–Q2 2026 results suggest rates are trending toward 2019 levels. Absent an extremely large CAT event ($150 billion+), this trend is expected to continue through year-end, though underwriter discipline around technical rate adequacy should not be discounted.
Catastrophe activity
Global insured CAT losses reached $107 billion in 2025 — the sixth consecutive year above $100 billion — led by the LA wildfires ($40 billion, the largest insured wildfire event on record) and severe convective storms ($50 billion). H1 2026 losses totaled $42 billion, the lowest first half since 2020, reflecting the absence of a repeat wildfire event and lighter SCS activity in Texas and the Southeast. TSR's August forecast calls for a below-normal Atlantic hurricane season (10 named storms, four hurricanes, one major hurricane), with just one hurricane and three tropical storms expected to make U.S. landfall — but a quiet H1 does not guarantee a quiet year, and a single major landfall could quickly tighten conditions.[1]
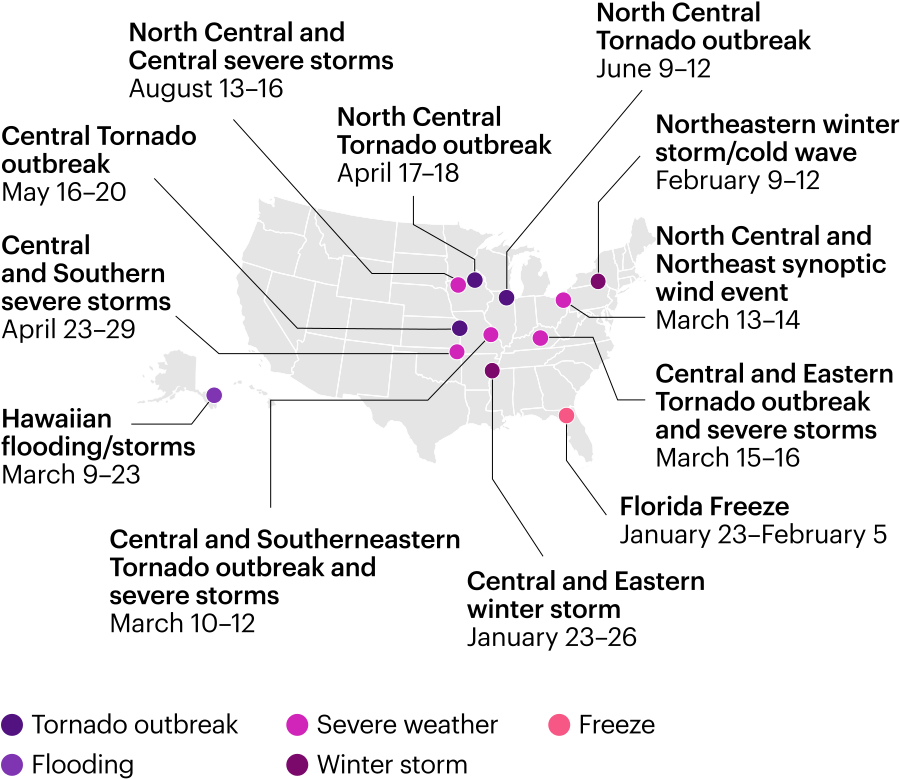
Recent catastrophic events from 2026
Reinsurance, profitability and valuation
Treaty reinsurance softening accelerated through each 2026 renewal date, with January 1 property catastrophe rate-on-line indices down 12–15% on abundant capacity, [2] and reinsurers entering H2 2026 in strong financial health following a roughly 19% 2025 ROE.[3] Most retail insurers reported 2025 combined ratios in the mid-80s to mid-90s, with 2026 trending similarly despite a handful of carriers posting combined ratios above 100%.[4] Meanwhile, replacement cost inflation is reaccelerating in 2026 across major indices (ENR, FM Global, RSMeans, Marshall & Swift) after easing through 2024–2025, driven by U.S. tariff policy and Middle East–related energy and supply chain pressures — reinforcing the need for accurate, recently updated valuations.
Construction cost indices since 2017
| Index | 2017 | 2018 | 2019 | 2020 | 2021 | 2022 | 2023 | 2024 | 2025 | 2026 |
|---|---|---|---|---|---|---|---|---|---|---|
| ENR - Building Cost Index | 3.3% | 3.3% | 1.74% | 3.96% | 13.94% | 9.4% | 2.9% | 1.9% | 2.8% | 3.9% |
| FM Global - US Industrial Buildings Average | 1.2% | 5.2% | 1.73% | 1.42% | 18.40% | 11.1% | 1% | 1% | -0.6% | 2.5% |
| RSMeans - 30 City Average | 4.0% | 5.5% | 2.05% | 1.71% | 15.83% | 12.1% | 1.9% | 1.3% | 0.1% | 4.7% |
| Marshall & Swift - US Average | 2.7 to 3.7% | 3.2 to 6.0% | 0 to 1.3% | 3 to 6.1% | 16 to 24.5% | 11.1% | 1.04% | 1.2% | 2% | 3.4% |
Considerations for insureds
Insureds should weigh the trade-offs between incumbent carrier relationships and new market engagement, monitor hurricane season and supply chain/tariff-driven rebuilding cost inflation and consider parametric, structured or captive alternatives to complement traditional placements. High-quality submission data remains key to risk differentiation and securing optimal terms in this environment.
WTW Innovation
Willis is investing simultaneously in data enrichment, proprietary pricing intelligence and broking technology. The integrated model rapidly converts these capabilities into actionable, targeted placement solutions, giving clients differentiated access to capacity and stronger leverage in volatile markets.
- Gemini: Since launching in September 2025, Willis' Gemini facility has become a significant competitive advantage for WTW clients. Available capacity has expanded from 12.5% to 16%, increasing access to A+ rated auto-follow capacity while delivering a 2.5% premium discount to lead terms
- Client Edge: Since launching in August 2024, Client Edge has delivered a stable, competitive solution, closing 2025 (its first full underwriting year) with strong written premium. Beazley Excess & Surplus capacity joined in March 2026 — a first-of-its-kind arrangement using U.S. paper rather than Beazley's traditional London capacity. H1 2026 premium is on pace to meaningfully exceed 2025's full-year total, with retention above 90%
- Other facilities: the Willis International Property Facility (automatic, fast-follow London capacity powered by Neuron), the Deductible Buydown Facility (100% deductible buydown for loan-mandated deductible levels), Digital Infrastructure Protector (announced April 2026, an end-to-end lifecycle solution for data center owners and operators) and the North American Property Lineslip (for S. clients with TIVs under $2Bn, offering automatic follow capacity up to $60 million with Gemini triggerable for a further $90 million)
Collectively, these initiatives demonstrate WTW's ongoing commitment to innovation and the delivery of sustainable, differentiated client solutions.
Industry spotlight: Data Center Technology
WTW is at the forefront of developing bespoke insurance solutions for insureds across the full Data Infrastructure spectrum, including fully owned facilities, co-location sites, cloud providers, hyperscalers and tenants of those facilities. We partner with the leading carriers in this space to address increasingly complex and evolving exposures, developing manuscript wording tailored to each client's unique risk profile.
Our team of technology-focused brokers, loss control engineers and valuation experts brings deep experience across the various operating models within this sector. This expertise allows us to offer informed advice that helps our insureds better understand and manage their risk, support sound risk management decision-making, and present their risk most effectively to the market — ultimately driving the most favorable terms and broader coverage.
Footnotes
- Jerome Jean Haegeli et al., Natural Catastrophes in 2025: The Persistent Rise of Wildfire and Storm Risk, Sigma 1/2026 (Swiss Re Institute, 2026), accessed August 26, 2026, Swiss Re Sigma Report. Return to article
- Ben Dyson, “Jan. 1 Renewals Set Stage for Lower Reinsurance Prices in 2026,” S&P Global Market Intelligence, January 29, 2026, accessed August 26, 2026, Jan. 1 Renewals Set Stage for Lower Reinsurance Prices in 2026. Return to article
- L.S. Howard, “Cedents Find Competitive Market Conditions at Midyear Reinsurance Renewals: Brokers,” Insurance Journal, July 2, 2026, accessed August 26, 2026, Cedents Find Competitive Market Conditions at Midyear Reinsurance Renewals: Brokers. Return to article
- L.S. Howard, “Reinsurance Rates Continued Softening During April Renewals, Despite Iran War,” Insurance Journal, May 4, 2026, accessed August 26, 2026, Reinsurance Rates Continued Softening During April Renewals, Despite Iran War. Return to article
Disclaimer
WTW hopes you found the general information provided here informative and helpful. The information contained herein is not intended to constitute legal or other professional advice and should not be relied upon in lieu of consultation with your own legal advisors. In the event you would like more information regarding your insurance coverage, please do not hesitate to reach out to us. In North America, WTW offers insurance products through licensed entities, including Willis Towers Watson Northeast, Inc. (in the United States) and Willis Canada Inc. (in Canada).
Contact

Download