

In Michael Lewis's 2003 book, “Moneyball”, the small-market Oakland Athletics baseball team had a winning season thanks to a team of talented players whose virtues were less appreciated by their richer competitors. The Athletics sniffed out those players by mining baseball statistics to find hidden patterns in past player performance that lead to future on-field success. The prolonged run of success enjoyed by Oakland spurred an analytical revolution across the entire sport of baseball. The “Moneyball approach” - using data analytics to find undervalued assets or novel connections - has inspired similar approaches across many types of businesses. But when it comes to catastrophe risks, there are some very good reasons why you can't just "Moneyball” it.
The insurance industry relies heavily on the concept of geographic diversification to limit its collective exposure to catastrophic perils. This concept rests on a specific statistical assumption: namely that classes of perils (such as tropical cyclones, wildfires, or earthquakes) in different parts of the world can be modeled as independent Poisson processes. Under that framework, insurers and reinsurers assume that, for example, high losses from west Pacific typhoons usually do not happen in the same calendar year as catastrophic wildfires in the western United States.
For specific combinations of perils and geographies, that assumption is undoubtably correct. The sudden movements of tectonic plates that produce earthquakes are entirely unrelated to the atmospheric and ocean precursors that foster the genesis of tropical cyclones, and so those perils are absolutely uncorrelated with each other. For other peril/geography combinations, the answer is not so clear cut. In 2016, Lloyd’s of London, in association with the UK Met Office, mined historical observations to identify any possible synchrony between those perils most relevant to the insurance industry. They concluded that the past several decades showed no apparent synchrony between perils and recommended (re)insurers were well justified to treat those perils as statistically independent.
As scientists who study the connections linking weather and climate across the globe, we worry this style of retrospective analysis – similar in some respects to the methods described in “Moneyball” -- could lead to the wrong conclusions about correlated weather-related risks.
Been in this game a hundred years, but I see new ways to lose I never knew existed before.”Casey Stengel
Correlated weather risks are a concern to insurers and reinsurers because of their potential impact on the upper tail of insured losses. To illustrate that point, let’s carry out a simple thought experiment. Imagine two places that are each affected by tropical cyclones each year – perhaps the west Pacific region and the Gulf Coast of the United States. For each region, we create a simulated set of storms and estimate insured losses based on a simple rule that storms with stronger winds cause more damage. We then run the simulations for many years (100,000 years) and examine how bad the portfolio's fractional losses can get.
We then add one more wrinkle to our experiment. In the first case, we force the simulated storms in each region to be completely unrelated. The occurrence of a tropical cyclone in one region tells you nothing about what’s happening in the other region. But in the second case, we require the cyclones in each region to be perfectly correlated with each other. In other words, when one site gets hit, so does the other.
The results of this thought experiment illustrate why insurers and reinsurers worry about the possibility of correlation between perils and between geographic regions (Figure 1). When the perils in each region are totally unrelated (as represented by the blue bars), a bad year at one place is usually paired with an ordinary year at the other, and the two tend to cancel out. The portfolio rarely has a totally catastrophic year, and, in most years, losses land somewhere close to the long-term mean. However, in the second scenario, losses are much more volatile. When tropical cyclones occur in perfect lockstep (the orange bars), that “cancelling-out” effect disappears and the variance of the annual loss distribution increases the “tails” at both ends.
Quiet years, by definition, cost nothing, so the extra density on the left-hand side is largely irrelevant to solvency. The tail of the loss distribution, on the right-hand side of the graphic, where the large, simultaneous losses occur, are the most important, as it is where an insurer's capital can be exhausted. Correlation across perils is therefore dangerous not because it raises average losses - in fact, the average loss in the portfolio over the long run is identical across both experiments - but because it fattens the heavy tail of risk that threatens solvency.
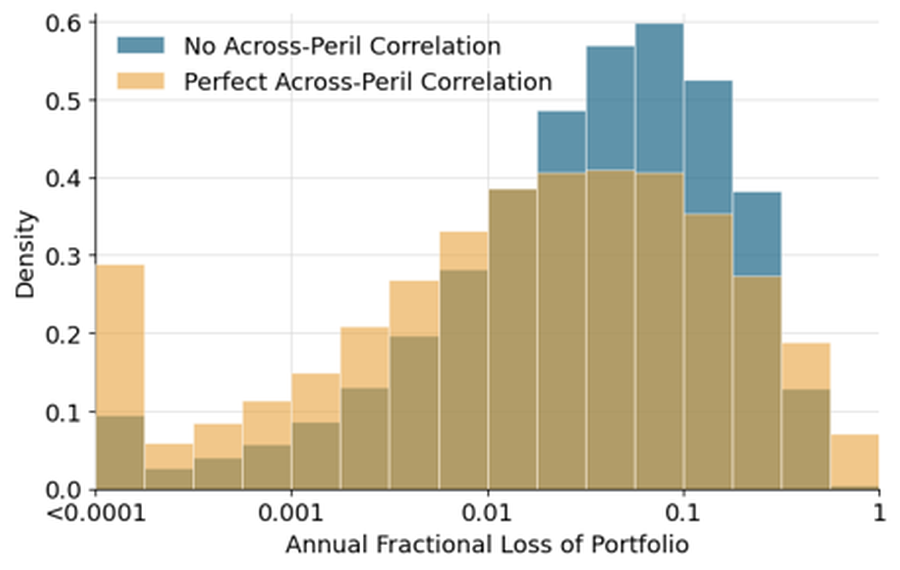
Figure 1. The impact of correlated tropical cyclones on insured losses
Annual fractional loss distribution of an imaginary “insurance portfolio” summed across two distant regions that both incur losses from tropical cyclones. In the first idealized experiment, there is no correlation in cyclones between the two regions (blue bars). The second experiment, there is perfect correlation between the same places (yellow bars). Notice the logarithmic scale for fractional loss, with near-total loss of the portfolio towards the right side of the x-axis.
Correctly assessing across-peril correlation is therefore of utmost importance, given its implications for the heavy tail of the loss distribution to insurance and reinsurance portfolios.
The obvious next question is, how best should we estimate the correlated risk? It may be tempting to turn to historical data to infer correlations between perils (to “Moneyball” it). But extreme events are, by definition, rare, so our past experience has only a handful of the simultaneous large losses that drive solvency risk. Because of that real-world limitation, our estimates of their joint behavior will almost always be approximate and often wrong. More often than not, an insurer or reinsurer that relies exclusively on a historical record of realistic length will fail to detect a loss correlation between perils – even if the perils actually are correlated! Just because segments of large, correlated losses haven’t shown up in the past doesn't mean they won't happen in the future.
Baseball isn’t statistics, it’s Joe DiMaggio rounding second base.”Jimmy Breslin
We also have another problem: climate change. The background climate state, which controls the frequency and intensity of perils as well as the coupling across perils, is itself shifting under warming, such that the statistical record of the past may no longer adequately describe the future. Returning to the Moneyball analogy, if their surrounding circumstances change, a player's past statistical performance may not always serve as a reasonable guide to their future performance. For instance, changes to their batting techniques, advancements in training and medicine, or even changes to the underlying rules of baseball, will almost certainly affect how well or how poorly they contribute to the team’s success in the future.
These fundamental problems drive home the importance of physical understanding: physics-based models, or models that simulate the actual physical processes driving these perils (such as climate models), can represent the drivers of correlation directly and, with some work, can also tell us how correlated risk might change as the climate evolves. Importantly, these models could help us generate plausible distributions of extremes that have not yet appeared in the record but are nonetheless possible, or even increasingly likely.
Over the past few decades, so-called “large ensembles” with physical climate models have become computationally feasible and enabled researchers to do just that: rerun historical climate over and over to generate a large sample of realistically correlated weather as it could have occurred instead of the weather we actually experienced. The 2002 Oakland Athletics won an American League record 20 games in a row, but that winning streak could easily have been broken earlier had a few key plays gone against them. In the same way, by leveraging large climate ensembles, scientists have been able to show that the correlation between extreme weather events can change substantially from one realization to another – simply due to good or bad luck.
Physical models are thus essential to building a more robust understanding of our lived and recorded experience, which in turn influences estimates of climate risk and thus insurance premiums. But these models also provide a more physically grounded perspective on how these risks might change going forward. This coming winter, all eyes are on the Pacific Ocean, where the forecast is for one of the strongest El Niño events on record to occur, likely disrupting weather worldwide. El Niños cause substantial economic damage across distant and otherwise uncorrelated regions. Their economic damage can also compound over subsequent years, making it one of the most important natural climate phenomena for the insurance industry to study. Physical models are unclear whether El Niños will become more or less frequent in the future, but they suggest, just like with hurricanes, that events might become stronger when they do occur.
If you challenge conventional wisdom, you will find ways to do things much better than they are currently done.”Bill James
Twenty years ago, the core insight of “Moneyball” was that traditional scouting relied too much on subjective judgment and the wrong statistics, which were poor predictors of a player's true future performance. Today, baseball teams have moved beyond even the Moneyball approach and no longer rely solely on historical performance statistics. Instead, they use physics-based tools, such as radar and optical tracking systems that measure bat speed, launch angle, spin rate, and pitch trajectory, to directly measure the biomechanical and physical drivers of a player's performance.
The insurance and reinsurance industries might benefit from the same sort of evolution. For decades, catastrophe risk has been too often assessed by fitting statistical models to historical data. But no amount of statistical sophistication can address the underlying issue that the historical record itself no longer describes the world being insured. The equivalent leap for insurers would be to embrace physics-based models, which are grounded in the actual physical processes that generate hurricanes, wildfires, floods, and their correlations (between perils and across geographies). We need tools that can represent the world, not only as it was, but as it is today and as it might be tomorrow.
Authors
Contact