


Annually, we produce a WTW Pension 100 analysis to provide a comprehensive view of funding levels, investment returns and risk management trends among the largest U.S. corporate defined benefit pension plans. Drawing on publicly disclosed information from year-end 2025 financial filings, this report examines how market conditions, sponsor financing and defined benefit strategy have shaped pension outcomes over time.
Many sponsors have transitioned from a prolonged period of underfunding to a position of relative strength.
The past several years have marked a notable turning point for corporate pension plans. A combination of favorable asset performance, rising interest rates and sustained risk management actions has led to a significant improvement in aggregate funded status across the Pension 100. The majority of plan sponsors now find themselves in a surplus position for the first time since before the financial crisis. Many sponsors have transitioned from a prolonged period of underfunding to a position of relative strength, enabling greater flexibility in funding and investment decisions.
At the same time, the pension environment continues to evolve. Plans are increasingly mature, with benefit payments exceeding new accruals for many sponsors. Plans that are in a surplus position continue to see those surpluses grow despite fairly conservative investment strategies. While plan sponsors with underfunded programs have had flexibility to defer cash contributions to allow investment returns to close the gap, that flexibility may be running out over the next few years. Market volatility continues to test the effectiveness of risk management strategies; fortunately, defined benefit plan funding levels have held up to date.
This report explores how plan positions have evolved, highlighting changes in funded status, discount rates, asset allocation, investment returns and employer contributions. The analysis provides insight into both the progress achieved and the emerging considerations facing plan sponsors as they navigate a more mature and risk aware pension landscape.
Key takeaways
- Aggregate funded status for the WTW Pension 100 improved again in 2025 and well exceeded full funding, despite a decline in discount rates
- Strong investment returns more than offset benefit payments to participants and liability growth; aggregate employer contributions have declined, but some employees continue to fund
- Continued de-risking through investment strategy and pension risk transfer is evident, with fixed-income allocations now exceeding 50% on average and public equity exposure falling below 30%
- As plans mature, funding outcomes are increasingly sensitive to interest rates, cash flows and contribution discipline rather than market upside alone
Aggregate funded status improved again in 2025
Aggregate funded status for the WTW Pension 100 increased again during 2025, leaving sponsors with an aggregate surplus of $32 billion on balance sheets at year-end, a $270 billion improvement over the past 10 years. The overall level of plan assets and liabilities has also declined, with plan assets of $914 billion and projected benefit obligations of $882 billion at year-end. Figure 1 shows how aggregate surpluses and deficits have fluctuated since 2007, reflecting periods of investment market volatility and low discount rates and then subsequent recoveries from equity market performance in higher interest rates since 2022.
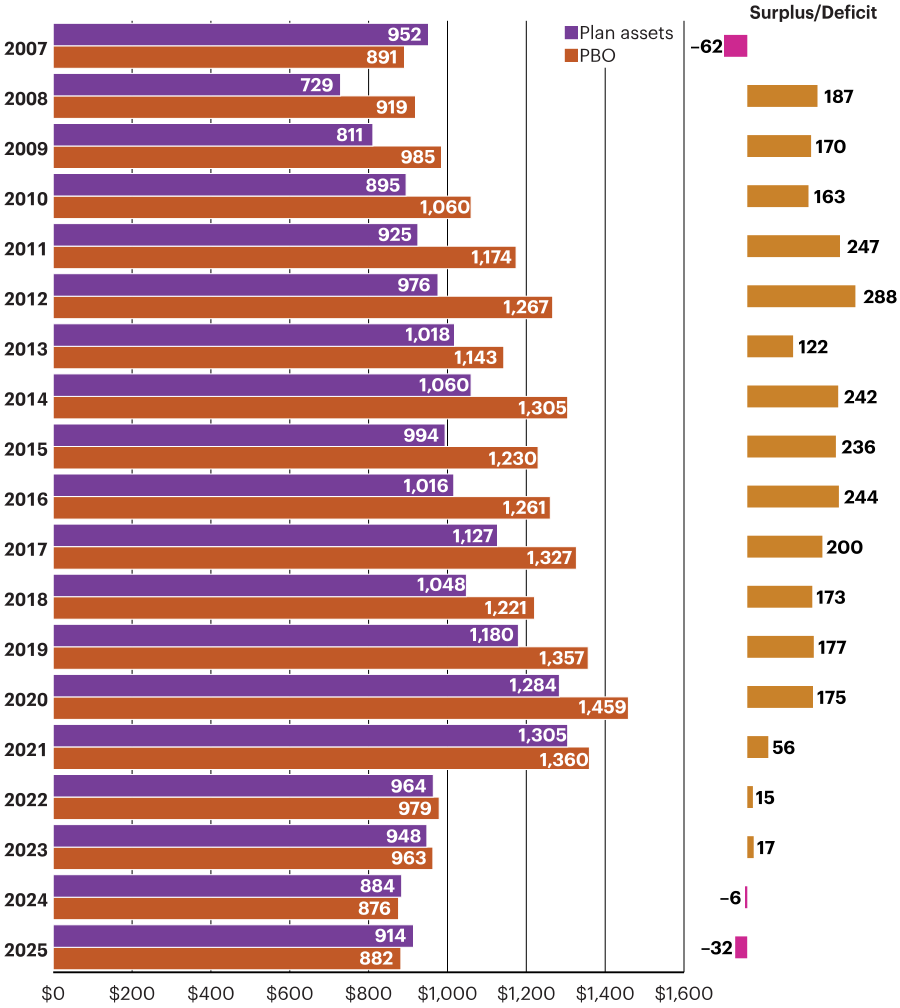
Figure 1. Aggregate funded status surplus/deficits of the WTW Pension 100 ($ billions), 2007–2025
Note: Pension liability values in 10-Ks also reflect nonqualified plans (which are usually not shown separately). An analysis of companies that disclose their qualified and nonqualified plans separately found that funded status is typically seven percentage points higher without the nonqualified plan obligations because these plans are typically not funded.
After remaining below full funding for most of the past decade, funded status in aggregate crossed above 100% in 2024 and improved further in 2025 to 104% (Figure 2).
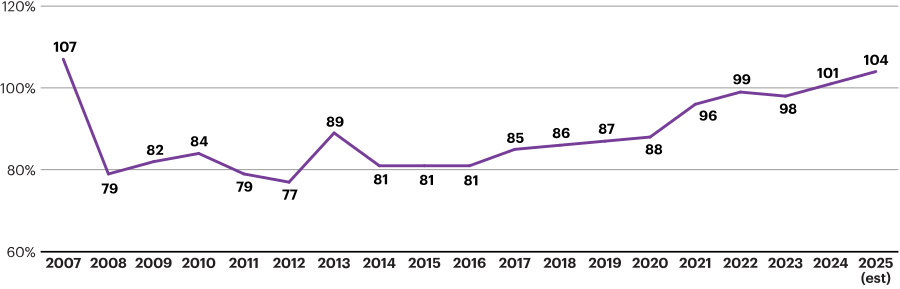
Figure 2. Aggregate funded status of the WTW Pension 100, 2007–2025
It’s important to note that balance sheet funded status figures in this analysis typically reflect both qualified and nonqualified U.S. pension plans given how companies report their defined benefit plan financials. Because nonqualified plans are typically unfunded, reported funded ratios would be higher if only qualified plans were included.
While aggregate results improved, funded status varied meaningfully across sponsors. Figure 3 illustrates the distribution of the proportion of the 100 plans attaining specific funded ratio targets over time.
By year-end 2025, approximately one-third of plans reported balance sheet positions that were above 110% funded, compared with 5% 10 years earlier. At the same time, only 4% of plans are funded below 80%, a stark contrast from 42% witnessed in 2015.
This shift reflects sustained improvements across much of the population, although differences remain driven by differences in asset allocation, contribution history and plan design.
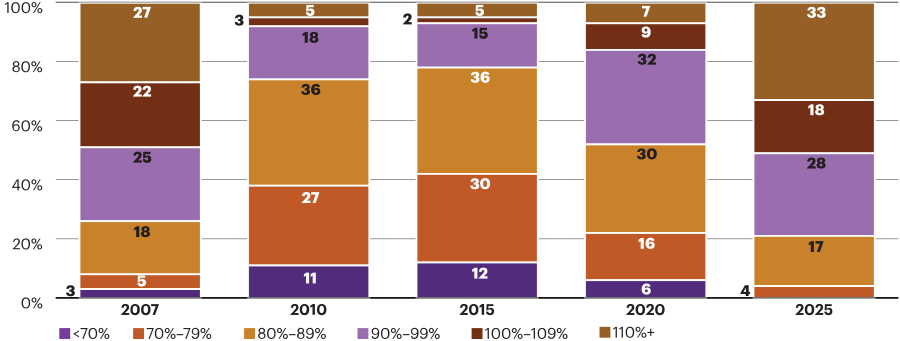
Figure 3. Distribution of funded status for the WTW Pension 100
Investment returns drove asset growth, outpacing obligations in 2025
Asset growth in 2025 was driven primarily by investment performance, not employer contributions. Plans experienced approximately $88 billion in investment returns, which more than offset $68 billion in benefit payment distributions to plan participants (Figure 4).
Employer contributions of approximately $14 billion provided additional support, though contributions varied significantly across companies.
For plan obligations, benefits earned by employees (service cost) and interest costs, including the effect of declining interest rates during 2025, were slightly larger than the $68 billion in benefit payments, moving up projected benefit obligations ever so slightly. But importantly, overall asset returns still exceed this growth, resulting in improved funded positions in aggregate.
It is interesting to note that benefit payments are significantly larger than service and interest costs, showing how obligations are anticipated to continue to decline due to the closing and freezing of many defined benefit pensions.
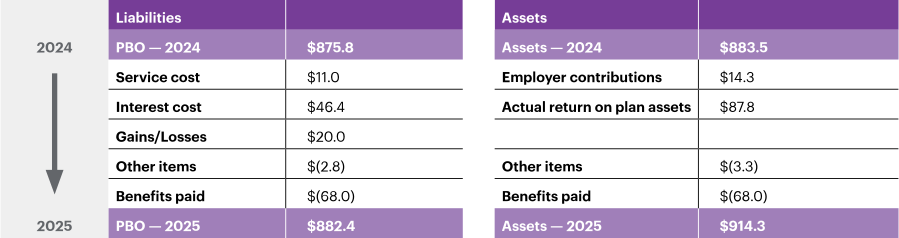
Figure 4. Changes in funded status from FYE 2024 to FYE 2025
Note: Other items consists mainly of settlement activity but also includes curtailments, plan amendments and mergers/acquisitions.
Asset allocation continues to shift toward fixed income
Investment de-risking continued in 2025. Figure 5 shows that average target allocations to public equity have declined to roughly 27%, down nearly 26 percentage points since 2010. Over the same period, fixed-income allocations increased by more than 23 percentage points and now represent the majority of defined benefit plan assets.
For many sponsors, achieving or maintaining full funding has been a primary objective, leading to a greater emphasis on preserving funded status rather than pursuing incremental return through higher-risk assets. The use of fixed income, or liability-driven investment strategies, aims to align the behavior of plan assets and liabilities from changes in interest rates; however, as de-risking reduces funded status volatility, it also lowers return expectations relative to liabilities.
Variability in allocation strategies across sponsors also reflects differing plan circumstances, including funded status levels, sponsor risk tolerance and whether employees are still earning benefits under the plan. While some plans have moved aggressively to lock in funded status through higher fixed-income allocations (typically those plans that are frozen and nearing full funding), others have retained growth assets to generate returns in a risk-controlled manner (typically plans with actively accruing benefits for some or part of their workforce). Note that the largest plans (as seen in the difference between average allocations and aggregate allocation) tend to allocate slightly less to fixed income in favor of alternative investments, which could involve diversifying strategies such as private equity and credit, or real assets, which tend to exhibit lower mark-to-market volatility than public equities.
Overall, the continued shift toward fixed income underscores the transition of corporate pension plans into a more mature phase, where risk management and funded status stability increasingly take precedence over return maximization.
Average target asset allocation (%)
| 2010 | 2015 | 2020 | 2024 | 2025 | 2026 | 2026 Aggregate | Percentage point change (2010–2026) | |
|---|---|---|---|---|---|---|---|---|
| Public equity | 52.5 | 43.0 | 37.5 | 27.9 | 27.4 | 26.6 | 26.3 | –25.9 |
| Debt | 34.5 | 42.6 | 48.3 | 54.8 | 57.4 | 57.6 | 53.5 | +23.1 |
| Cash | 0.8 | 1.0 | 1.4 | 1.7 | 1.3 | 1.8 | 1.5 | +1.0 |
| Real estate | 3.4 | 3.2 | 3.5 | 3.3 | 3.1 | 3.1 | 4.3 | –0.3 |
| Other | 8.8 | 10.2 | 9.3 | 9.8 | 10.4 | 10.9 | 14.5 | +2.1 |
Note: Represents investment strategies for the oncoming year. Some firms reported their targets in terms of a single value, while others reported a range. If the target allocation was given as a range, we normalized the results. Other includes target percentages for private equity, hedge funds, alternative and miscellaneous asset clases when reported.
Declining discount rates, increased liabilities
Average year-end discount rates declined by approximately 22 basis points during 2025. This reversal followed increases in discount rates during the first part of this decade that had reduced projected benefit obligations (Figure 6).
The decline in discount rates increased liabilities during 2025, partially offsetting asset gains. As plan sponsors allocate more to fixed-income assets, which are designed to largely hedge changes in plan liabilities due to interest rates, a portion of these asset gains were attributable to strong fixed-income returns during 2025.
Since the substantial rise in interest rates in 2022, supported by stronger funding levels, many plan sponsors have decided to further refine their hedging strategies to reduce the effect of interest rates on funding position. While the magnitude of the rate decline in 2025 was modest relative to prior periods, the fact that funding position still improved highlights that sponsor balance sheets have lower overall risk from interest rates today than in years past.
The experience in 2025 also illustrates how interest rate changes interact with plan maturity. For many sponsors, liabilities are becoming shorter in duration as plans mature (particularly for those that froze pension benefits many years ago), with near-term benefit payments representing a larger share of total obligations. Discount rates used for measuring pension obligations are more sensitive to midterm bond yields today versus long-term yields, although this varies from plan to plan; thus, the objectives, and tools, for managing interest rate risk vary from sponsor to sponsor.
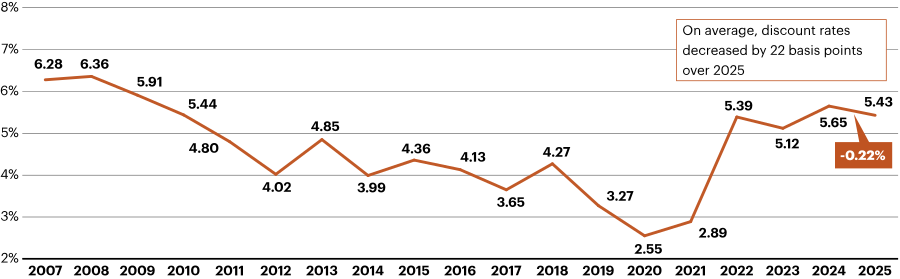
Figure 6. Average year-end discount rate assumptions for WTW Pension 100, 2007–2025
Long-term investment returns remain solid, but volatility persists
Since the financial crisis, annualized investment returns for the WTW Pension 100 have averaged approximately 7%; however, results over shorter horizons have been more volatile (Figure 7).
Periods of strong growth asset returns have contributed meaningfully to funding improvements, while negative returns during market downturns underscore the risks inherent in maintaining return-seeking exposure, particularly for mature plans with negative cash flow due to sizable benefit payments to plan participants.
The historical returns highlight the ability of pension portfolios to generate meaningful growth over time, even amid varying economic and market conditions. Strong returns during periods of equity market expansion have played a significant role in improving funded status, often offsetting prior periods of weaker performance.
The variability in annual returns underscores the importance of understanding sequence-of-returns risk, particularly for plans that are paying out more in benefits than they receive in contributions. For these plans, periods of negative or below-average returns can have a disproportionate impact on funded status, as assets are drawn down to meet benefit payments during unfavorable market environments.
The historical return patterns shown below reflect the evolving asset allocation mix across the Pension 100. It’s important to note that when comparing absolute returns, the effect that sponsors hold higher levels of fixed income results in returns that are also subject to interest rate changes throughout the year (coinciding with obligation changes); thus when returns are being affected by changes in interest rates, what can appear volatile on an absolute level may not result in volatility in funded position.
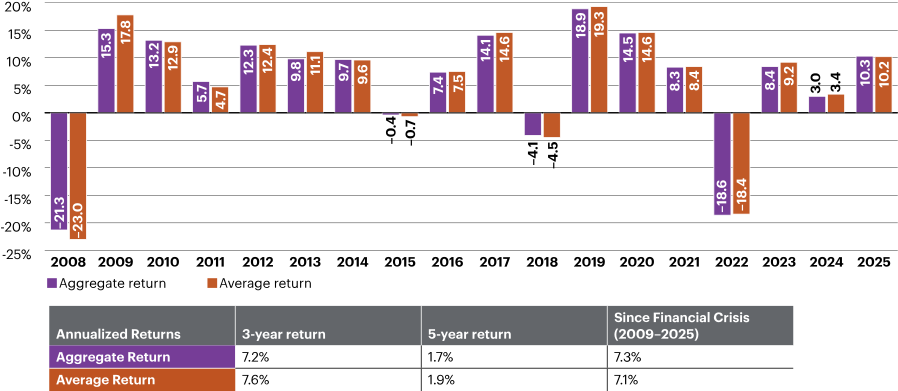
Figure 7. Investment returns for the WTW Pension 100, 2008–2025
Employer contributions remain at historically low levels
Contributions made in 2025 reflect an uptick in aggregate employer contributions relative to 2024; however, the magnitude remains modest when viewed against historical contribution levels following prior market downturns (Figure 8). After prior periods of market stress and resulting underfunding, contribution levels rose sharply as sponsors sought to rebuild funded status (either voluntarily or due to required minimum contributions). Because many plans now find themselves fully funded (perhaps even in surplus), many sponsors are not anticipating sizeable contributions. Underfunded plans, however, may be running out of time for investment returns to close the gap before cash contributions become required. Contribution behavior continued to vary widely across sponsors. Figure 8 shows that while some companies increased contributions materially in 2025, many reduced or maintained contributions as funded status improved.
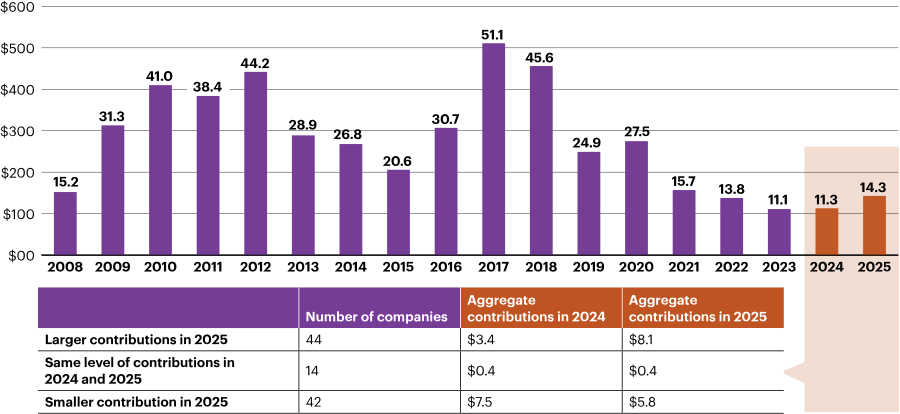
Figure 8. Employer contributions for the WTW Pension 100 ($ billions), 2008–2025
Looking ahead: Strong financial position creates opportunities
The 2025 results indicate that the majority of the largest U.S. defined benefit plans are in a strong financial position. Improved funded status has enabled sponsors to reduce contributions and enabled the de-risking of investment strategies and risk transfers. Many plan sponsors find themselves in a surplus position, which can be used to facilitate further de-risking, provide benefits to employees or finance other legacy benefits.
Based on market conditions through mid-May 2026, we anticipate that these defined benefit plans’ funded positions have improved further. Increases in interest rates have reduced projected benefit obligations, while equity markets have continued to deliver positive returns.
Fixed-income returns have been modestly negative amid rising yields, reflecting the effects of higher interest rates on bond prices. For plans with substantial allocations to fixed income, these results temper — but do not fully negate — the positive impact of lower liabilities.
Plan sponsors in 2026 are considering their next actions to manage their defined benefit plans. Plans in surplus are actively exploring the value of pension surplus and how best to unlock that value. Plans that may have cash contributions on the horizon are planning for how to align funding with their planned cash flow needs. The risk transfer market remains active, and sponsors continue to refine their investment strategies. As the financial position of the largest U.S. defined benefit plans continues to improve, plan sponsors have an opportunity to continue to ensure that these programs remain sustainable for the future.