

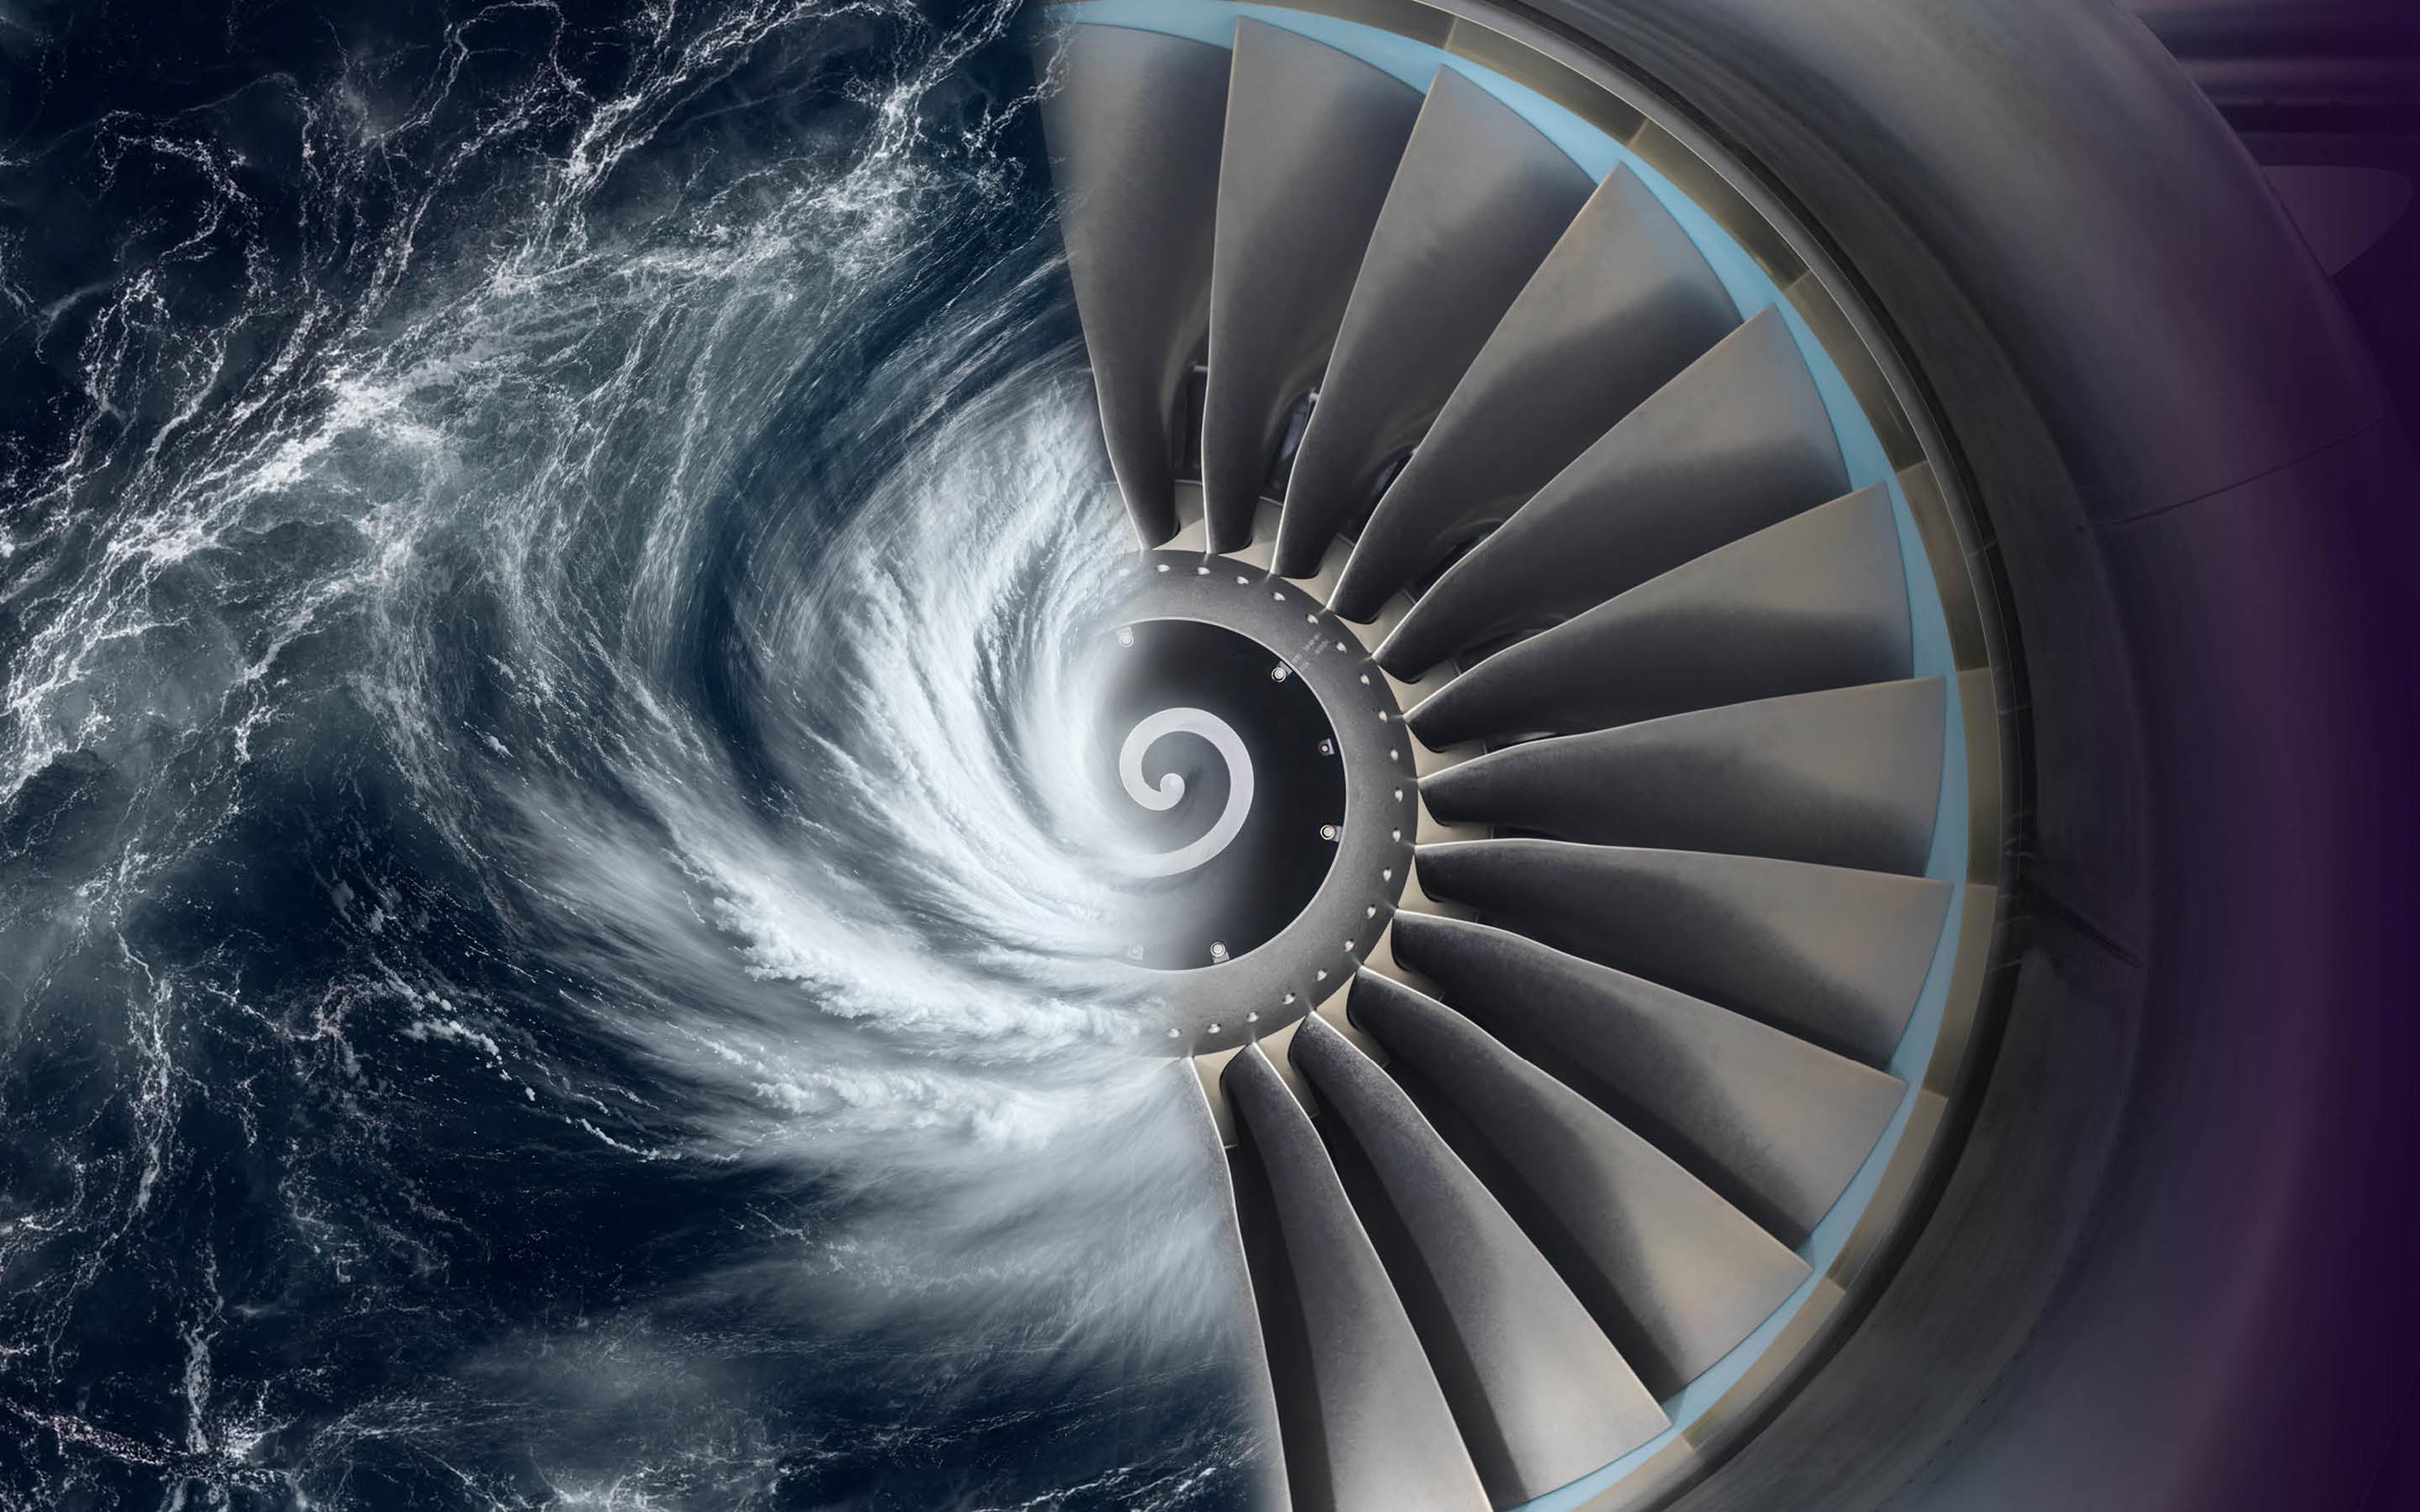
Much like buses, extratropical cyclones can arrive in groups. Several powerful storms may hit within days or weeks of each other rather than occurring as isolated events. This is known as “storm clustering”, and it is an important challenge for the insurance industry because aggregated losses can build quickly across a short period of time.
In 2006, the Willis Research Network (WRN) began collaborating with the University of Exeter to better understand this risk across Europe. A major breakthrough came in 2008, with the research published the following year as “Serial clustering of intense European storms” (Vitolo et al., 2009). The paper, which has since been cited more than 170 times, showed that the most damaging storms are more likely to occur in clusters.
The clustering phenomena
An example of windstorm clustering is the sequence of Dudley, Eunice and Franklin. These all hit the UK within a single week in February 2022, leading to over £3.3 billion of insured losses (PERILS, 2023).
However, storm clustering doesn’t just occur over short timescales. Over five weeks from late January 1990, Europe was hit by eight storms. Rather than a severe single event, insurers faced repeated losses over several weeks.
Storm clustering not only results in larger aggregate losses, but it poses challenges for occurrence-based catastrophe excess-of-loss (CatXL) policies. Under hours-clause event definitions, the largest “event” in a year could in fact consist of multiple storms occurring close together in time.
(Re)insurers had been aware of this phenomenon since the 1990s, but early catastrophe models couldn’t replicate this phenomenon so any impact on portfolios could not be calculated.
A mathematical way to measure windstorm clustering was required
Earlier research from the University of Exeter had already developed a way to measure how storms cluster over time using a statistical method called the “dispersion statistic”. This initial study linked storm clustering to atmospheric pressure patterns (Mailier et al., 2006). However, not every storm that forms over the Atlantic causes damage.
The 2008 study therefore focussed on the extreme events. The research found that the strongest storms are more likely to occur close together in time than weaker storms. In simpler terms, the storms that matter most financially are also the storms most likely to arrive in groups.
Storm clustering enters catastrophe models
Since 2008, catastrophe models offering clustering of European windstorms have been available. The methodology has been updated as academic understanding has evolved, including the fact that stronger storms are more likely to cluster. Current European windstorm catastrophe models explicitly consider event clustering, with event sets now separated into “clustered” and “non-clustered” views of windstorm risk. These views have differences in the distributions of aggregate losses, particularly for the most extreme loss years. The work by the WRN in 2008 was a key component in this “clustering revolution”, which shaped catastrophe models into their present-day form.
Twenty years later: Storm clustering in Portugal
This hasn’t meant the end of the WRN’s partnership with the University of Exeter though, recent analysis quantified the likelihood of storm clustering for regions not covered by catastrophe models.
In January 2026, storm Kristin formed part of a cluster of three strong storms that hit Portugal within six days. Analysis suggested this cluster was a one-in-12 year event. The research also explored more extreme scenarios that have not yet been seen in the historical record. For example, it is possible for Portugal to experience three severe storms within just three days, although this would be much rarer, with a return period of around 150 years.
What do future storms clusters look like?
Although scientists now have a strong understanding of storm clustering, important questions remain. Researchers are using climate models to explore present-day “worst-case” storm sequences and atmospheric conditions that produce them.
There is also uncertainty about how storm clustering may change in the future as the climate warms, partly because climate models do not always agree on the signal. Understanding why models produce different results of storm clustering will further improve our understanding of this risk.
Through its partnership with the University of Exeter, the WRN continues to be at the forefront of this research, and we invite you to join the conversation with us.
Key takeaways
- Work from a WRN partner added mathematical evidence to the idea that windstorms cluster in time.
- It was then shown that extreme windstorms are more likely to cluster.
- This was widely adopted in catastrophe models, and continues to be a topic of ongoing research to this day.
“The WRN collaboration enabled us to discover that, non-intuitively, more extreme storms are actually more clustered than weaker ones, which helped lead to windstorm clustering being better represented in catastrophe models and on the Willis financial platform."Prof. David StephensonUniversity of Exeter
Authors



20 years of the Willis Research Network