


The debate regarding the structural divide between U.S. and European executive compensation practices has moved from the periphery of boardroom discussions to the very top of the Remuneration Committee agenda. While much has been made of the absolute difference in quantum and structure between the pay markets, there's been far less discussion regarding how pay practices in these markets have evolved over the past 10 years, the nature of the pay-for-performance link and how target and actual pay scales with organization performance.
In this edition of Executive Pay Matters, we discuss the findings of a longitudinal 10-year analysis of the divergent pay regimes in the global biopharma industry, examining the pay-for-performance link and the mechanics of how value creation translates into CEO rewards. The analysis is based on a comparator group of 14 global biopharmas — comprising seven U.S.-based and seven European-based organizations — selected for their comparable market capitalization and global footprint.
Key findings
- The U.S. has a much higher "Price of Entry" for CEO talent: U.S. target total direct compensation, i.e. base salary, target bonus and long-term incentives ('TTDC'), begins at more than double the European baseline ($17.4 million vs $8.6 million) and scales aggressively (+$2.1 million per doubling of Total Shareholder Return ('TSR')). European pay remains "performance-insulated," anchored to fixed policy cycles with almost no scaling based on performance
- The 3x performance multiplier: The U.S. model is three times more sensitive to value creation. For every doubling of shareholder value, a U.S. CEO's actual realized pay increases by +$15.9 million, compared to +$4.9 million for European companies
- The structural ceiling: Even where European organizations deliver market-leading growth, the gravitational field of regional governance and pay-model design maintains a significant gap in realized executive wealth compared to U.S. peers
- Incentives for outperformance: While the cost of CEO pay is higher in U.S. organizations, returns to shareholders have also been materially higher than in Europe. While in this analysis the relationship remains one of correlation rather than causation, the strength of this association points to the possibility that more powerful incentives can drive superior value creation
- Evolution of the 'Risk Gap': Over the last decade, Europe has slowly structurally shifted towards the U.S. model, increasing LTI weighting in the target package from 44% to 53%. However, this is chasing a moving target; U.S. equity weightings have climbed higher and now 91% of a U.S. CEO's package at target is 'at-risk'. This means that a U.S. CEO's actual pay outcomes are exponentially amplified during growth cycles
- Long-term value alignment: Actual LTI outcomes track TSR performance 5.6x more closely than annual bonus outcomes. This confirms that long-term incentives generally function as an effective tool to reward performance and align executives with the shareholder experience
This constitutes the first part of our series on executive talent and reward, focusing on regional pay-for-performance dynamics and structural divergence.
The second part of the series will look at new hire premiums and the specific challenges of succession planning in the global biopharma talent market.
Contacts



Regional CEO target pay-for-TSR-performance elasticity
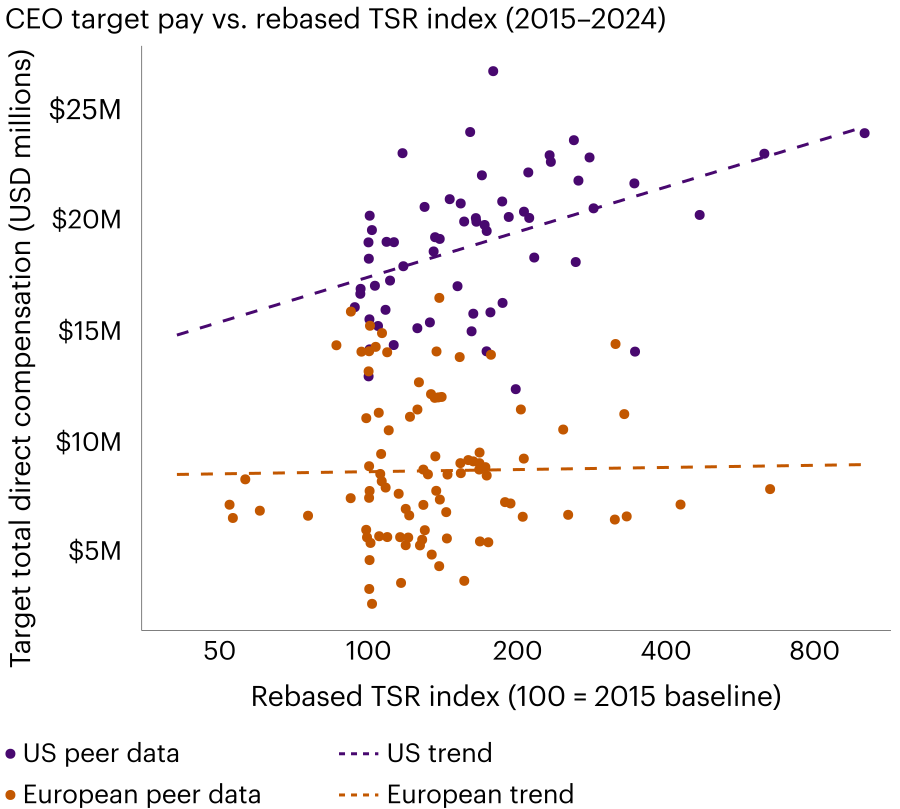
CEO Target Pay vs. Rebased TSR Index (2015-2024)
- The 'price of entry' for U.S. CEO talent is high: A comparison of the trendlines reveals that at the 2015 baseline, U.S. TTDC begins at $17.4M, while the European equivalent starts at $8.6M. This regional premium means a U.S. CEO begins with a pay baseline more than double that of a European peer, reflecting the significantly higher floor of the U.S. market
- U.S. target pay scales in accordance with TSR growth: The cost of talent doesn't just start higher; it scales in line with company performance. For every doubling of shareholder value, the U.S. trendline adds +$2.1M in TTDC, while the European trendline adds only $0.1M. This creates a widening "talent tax" that is making it even more difficult for European organizations to compete for high performing U.S. CEO talent
- European TTDC has been "performance-insulated": The flat European line represents a regime where target pay positioning is remarkably stable, irrespective of performance delivered. Remuneration Committees in Europe have historically maintained a conservative approach to target pay positioning even during periods of exceptional success. Target pay is anchored to a fixed policy benchmark reviewed on a three-year cycle, with interim increases largely confined to base salary progression
- In the U.S., demonstrable TSR growth is "pre-programmed" into TTDC: Remuneration Committees reassess LTI grant values against market data each year, resetting the baseline upward, which in turn lifts the reference point for peers and further ratchets up pay. This effect is compounded where Remuneration Committees factor individual performance into grant sizing, meaning a high-performer may receive 125% of the (already upwardly adjusted) target, amplifying the gap year on year. The result is a structural divergence in how LTI accumulates over time, even where starting grant levels may appear broadly comparable
- No global market convergence: The divergence demonstrates that a standardized global price for CEO talent does not yet exist. Instead, we see two distinct regional regimes: a High-Floor, High-Elasticity U.S. model and a Low-Floor, Low-Elasticity European model. While a number of European companies have put forward bold policies in an attempt to close the gap with U.S. peers, a significant quantum divide remains
- Strategy over scarcity: The tight clustering of European data points suggests a "follow-the-leader" approach to market positioning within the European peer group. Conversely, the wider spread in the U.S. suggests that, as referenced above, U.S. Remuneration Committees exercise more individual discretion, treating CEO pay as a bespoke strategic lever rather than a regulated utility to be managed in line with the external market and wider stakeholder expectations
Company-specific insights
| Company | Region | TTDC positioning vs. regional trend line | Insights |
|---|---|---|---|
| Eli Lilly | U.S. | On-trend | Represents the "High-Elasticity" model; TTDC has scaled aggressively in line with exceptional TSR performance |
| AstraZeneca | Europe | Above-Trend | A deliberate departure from the European regime with positioning of TTDC above European norms |
| AbbVie | U.S. | Below-Trend | Despite being below the U.S. trend, its TTDC remains $6M higher than the European starting baseline |
| Johnson & Johnson | U.S. | On-trend | Anchors the U.S. "High-Floor" model; maintains a $10M+ TTDC lead over European counterparts despite comparable performance |
| Novo Nordisk | Europe | Extreme Below trend | Reflects a "performance-insulated" philosophy; TTDC positioning remained decoupled from what was, over the period to the end of 2024, among the strongest TSR growth in the peer group |
| GSK | Europe | On-Trend | Typical of the "Low-Elasticity" European model; maintains a conservative, stable target pay level relative to European peers, noting that a new remuneration policy introduced after the end of the data series analyzed here will have repositioned GSK somewhat closer to the U.S. model |
Regional CEO actual pay-for-TSR-performance elasticity
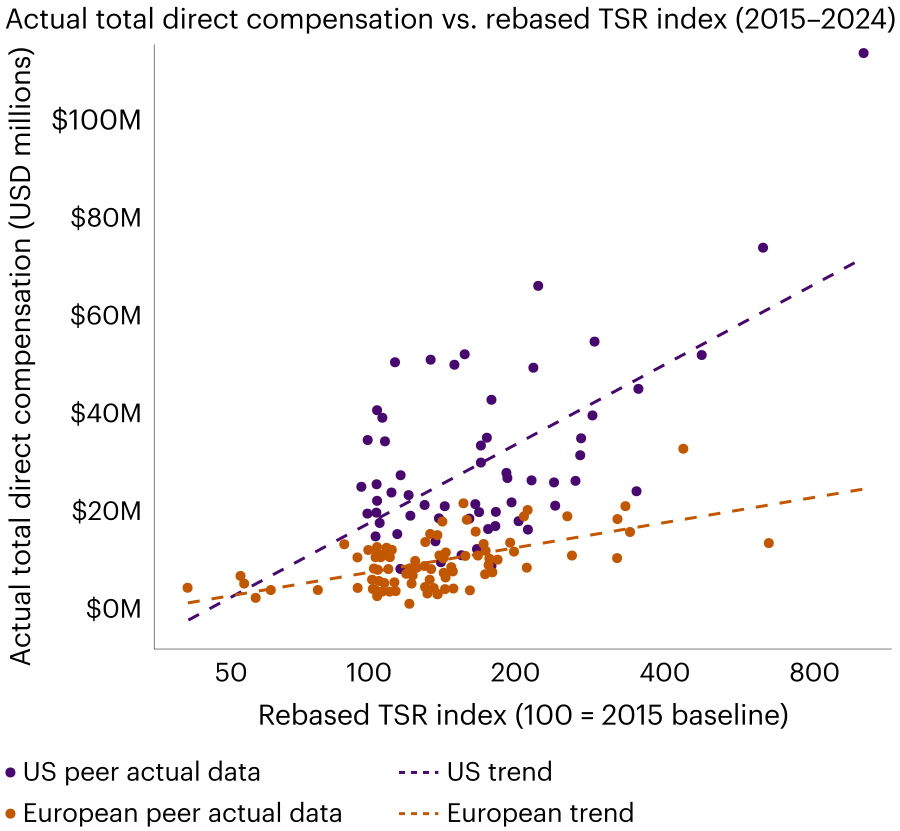
Actual Total Direct Compensation vs. Rebased TSR Index (2015-2024)
- The U.S. pay "performance multiplier" is more than 3 times stronger than in Europe: The most significant difference between the two regimes is how they reward a doubling of shareholder value. For every 100% increase in the TSR Index (e.g., from 100 to 200), a U.S. CEO's actual pay increases by an average of +$15.9M. For that same doubling of value, a European CEO realizes +$4.9M. Thus, the U.S. pay model is more than three times as sensitive to shareholder value creation
- Looking from the other end of the telescope, the data reveals a stark difference in capital efficiency. For every $1,000 of incremental pay, a European CEO delivers over 3x more relative TSR growth than a U.S. peer. While the U.S. model is designed for high-leverage sensitivity, the European regime offers shareholders a significantly lower 'cost of growth'—buying far more value creation for every dollar of reward
- European realized pay is horizontally clustered: The data reveals a fundamental difference in the extent to which outperformance is reflected in realized pay. Even when a European organization achieves market-leading TSR growth, the CEO's actual pay remains within a narrow, predictable range—typically under $15M. This stability is partly a direct result of a more conservative approach to setting target pay levels in the European market
- Higher actual pay in the U.S. is backed by stronger TSR growth: Higher actual pay in the U.S. does not happen in a vacuum; it is the by product of significantly stronger shareholder returns. Over the last decade, U.S. companies in this peer group delivered an average total TSR growth of 265%, compared to 117% for European peers. On an annual basis, U.S. organizations grew their value by 14.4%, nearly double the 8.2% annual growth rate observed in Europe. For context, over the same period, the S&P 500 delivered total returns of approximately 194%, while the EURO STOXX 600 returned approximately 53%, suggesting that these pharma organizations have outperformed their respective domestic indices
Aggregate actual pay-for-TSR-performance analysis
- U.S. companies dominate the top right quadrant: Underscoring the difference in TSR performance between the markets, the top right quadrant includes all but one of the U.S. organizations. The only European organization to feature is AstraZeneca, reflecting its position as a regional outlier that has, in recent years, more closely aligned its quantum to U.S. norms and has simultaneously delivered the highest TSR growth of the European basket of peers. However, despite AstraZeneca achieving the second-highest TSR growth, its total aggregate pay remains below all U.S. peers, many of whom have a significantly weaker performance story.
- Pay-for-performance disconnect: Where an organization is positioned in the bottom right of the quadrant (i.e., Merck KGaA), having delivered strong TSR performance, which is not reflecting in high aggregate pay, this may not strictly be a pay competitiveness issue. Instead, it may point to a structural issue with metric selection or target setting, where performance hurdles may be inherently more stretching than those of peers. Conversely, organizations in the high-pay, low TSR growth quadrant may be setting their performance targets with inadequate stretch.
- Pfizer presents a clear example of the high U.S. 'price of entry' in practice: Aggregate pay remains disconnected from TSR performance relative to the comparator group. Despite delivering TSR growth below the majority of European peers—the CEO's aggregate actual pay was approximately $223M. This represents a payout more than double that of a number of European peers who delivered significantly stronger TSR growth.
- European pay ceiling: The visualization of the aggregate data confirms that the transatlantic divide is not merely about performance, but about a structural ceiling. This suggests that even if European companies continue to close the TSR performance gap, the structural gravitational field of regional governance and pay-model design and quantum will likely maintain a significant divide in realized executive wealth for the foreseeable future.
Evolution of the CEO’s target pay mix in the U.S. and Europe: 2015 to 2024
- The European market shift toward long-term pay: Ten years ago, a European CEO's package was more balanced across components, with LTI accounting for 44% of the TTDC mix. Since then, Europe has made a clear structural shift, increasing its LTI weighting by 9 percentage points (reaching 53% in 2024). However, this modernized European model is still significantly less leveraged than the U.S. was in 2015 (when U.S. target LTI was accounting for 74% of the TTDC mix). In this respect, European organizations have been chasing a moving pay mix target as U.S. equity weightings continue to climb. Importantly, the European shift has been primarily a reallocation from short-term incentives towards long-term incentives, rather than a reduction in fixed pay. The overall variable component has grown, but the character of that variability has changed, with European Remuneration Committees increasingly favoring equity-linked, multi-year reward over annual cash bonuses
- The compression of base salary in the U.S. market: In the U.S. market, base salary has been reduced to just 9% of the total target package. A U.S. CEO now operates with 91% of their pay "at-risk" (STI + LTI), compared to 77% in Europe. This 14-point "Risk Gap" explains why U.S. actual pay is so much higher than European when the performance landscape is strong, as the vast majority of the U.S. package is amplified by share price growth
Long-term incentive outcomes track TSR performance more closely than annual bonus outcomes
Actual long-term incentive outcomes track TSR performance 5.6x more closely than annual bonus outcomes (r=0.68 vs 0.12).
The high correlation between long-term incentive outcomes and TSR performance is driven by two reinforcing factors. First, relative TSR is typically a primary, formulaic performance metric within long-term incentives, determining the number of shares that ultimately vest. Second, as these awards are delivered in equity, the actual value realized by the executive is further scaled by the change in share price.
The weak correlation between annual bonus outcomes and TSR performance (r=0.12) presents a distinct governance challenge. It suggests that annual bonuses are frequently decoupled from external market reality, rewarding internal operational or financial milestones even when the shareholder experience is stagnant or negative.
Consequently, Remuneration Committees may find themselves in the difficult position of having to justify significant bonus outcomes during periods of share price volatility or underperformance. To maintain institutional credibility, Boards must ensure that the "operational success" captured in the annual bonus is balanced against the "market success" reflected in the long-term incentive, preventing a narrative of "pay-for-failure" when the broader investor experience may be challenging.
LTI weighting in the pay mix positively correlates with TSR growth in the U.S.
- In the U.S. market, where the share of target LTI in TTDC is typically significantly higher (averaging 70-80% of the pay mix), there is a moderate correlation between a higher proportion of LTI in the pay mix and TSR performance. Eli Lilly and Merck & Co. (who have the highest LTI proportion) are among the top performers. Pfizer has the lowest LTI proportion of the U.S. group (72%) and also has the lowest 10-year TSR growth (36%) among those peers
- For European peers, the link disappears. This is primarily because performance in this group is driven more by specific company factors than by the pay mix structure. Novo Nordisk is the primary "disruptor" of the correlation here. They have a relatively conservative LTI proportion (39%) but the second-highest TSR performance
Conclusion
While more European organizations are shifting their quantum and mix to more closely mirror U.S. norms, the current trajectory suggests this evolution will be slow and incremental. The analysis reveals that the transatlantic divide in executive compensation is not merely a matter of scale, but a fundamental difference in how pay-for-performance is engineered. This reinforces the conclusion that there is no single, unified approach to CEO pay across what is increasingly a global talent market; instead, firms are continuing to navigate two distinct regional regimes where the gravitational field of governance and regional norms continues to counteract market forces driving towards global convergence.
WTW helps boards diagnose where current pay design supports, or constrains, the company's strategy, testing whether the current package is fit for purpose in the relevant talent market, and identifying the specific changes needed to improve competitiveness without losing credibility with investors and other stakeholders. That can range from recalibrating pay mix and performance leverage, to reviewing target-setting and metric design, to defining the pay philosophy needed for succession and external hiring in a global market.