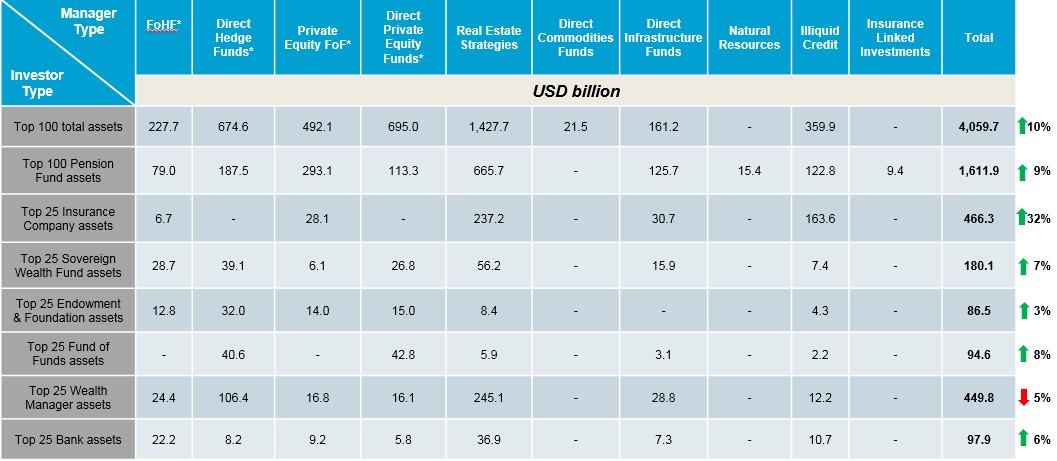
SYDNEY – Tuesday, 18 July, 2017 – The world’s largest 100 alternative asset managers saw assets under management increase by 10% in 2016, rising to US$4 trillion, according to the 2017 edition of Willis Towers Watson’s Global Alternatives Survey. The survey, which captures long-term institutional investment trends by seven main investor groups across ten alternative asset classes, showed that of the top 100 alternative investment managers, real estate managers have the largest share of assets (35% and over $1.4 trillion), followed by private equity fund managers (18% and $695bn), hedge funds (17% and $675bn), private equity funds of funds (PEFoFs) (12% and $492bn), illiquid credit (9% and $360bn), funds of hedge funds (FoHFs) (6% and $228bn), infrastructure (4% and $161bn) and commodities (1%).
In terms of the gth by asset classes among the top 100 asset managers, illiquid credit saw the largest percentage increase over the 12-month period, with AuM rising from $178bn to $360bn. Conversely, assets allocated to direct hedge fund strategies among the top 100 asset managers fell over the period, from $755bn to $675bn.
Nick Kelly, senior investment consultant at Willis Towers Watson, said: “As capital supply and competition have increased in some segments of the illiquid credit universe, such as direct lending for example, yields are not always offering sufficient compensation for illiquidity and risk. At the same time, we have seen some withdrawal of capital from hedge funds in the face of high fees, skewed alignment of interests and performance headwinds. It appears that the ging groundswell of negative sentiment that has arisen due to the aforementioned issues is now showing up in the decisions of asset allocators. We have been surprised it has taken this long to observe the trend turn, however this is aligned with our long-held view that the hedge fund industry needs to change, with those willing to offer greater transparency and display value for money likely to prosper going forward.”
Data for the total alternative investment universe, shows that overall alternative assets under management now stand at just under $6.5 trillion, across 562 entries. North America continues to be the largest destination for alternative asset manager allocations (54%). Overall, 33% of alternative assets are invested in Europe and 8% in Asia Pacific, with 6% invested in the rest of the world.
The research also highlights that, when looking at the distribution of assets within the top 100 alternative asset managers by investor type, pension fund assets represent a third (33%) of assets. This is followed by wealth managers (15%), sovereign wealth funds (5%), endowments & foundations (2%), banks (2%) and funds of funds (2%). Notably, insurance companies’ proportion among the top 100 alternative asset managers grew from 10% to 12% of total manager assets.
Nick Kelly said: “We continue to believe that, despite real estate in many regions looking attractive relative to government bonds, investors should be patient and selective when investing new real estate allocations at the current time. Many developed markets are at higher points in their real estate cycles, meaning one needs to be increasingly cautious of higher risk property strategies, particularly those using high levels of debt. We have also seen a ging interest in alternative property sectors such as storage, student housing and healthcare real estate. We expect some of these sectors to be more defensive through the cycle as they are often less economically sensitive relative to traditional property sectors and more aligned to thematic tailwinds such as ageing demographic.”
Pension fund assets managed by the top 100 alternative asset managers now stand at $1.6 trillion, up 9% compared to last year’s study, and represents 51% of their total AuM. Illiquid credit allocations for this group doubled to 8% over the 12 months, whilst real estate managers continue to have the largest share of pension fund assets with 41%. This is followed by private equity FoFs (18%), hedge funds (12%), infrastructure (8%), illiquid credit (8%), private equity (7%) and FoHFs (5%).
Nick Kelly commented: “Deployment by institutional investors into the infrastructure asset class has increased again. In fact, 2016 saw a number of records set in the unlisted infrastructure fundraising industry. There is also a record number of funds in the market now seeking capital to try and take advantage of the asset class’s gth in popularity. We have seen an ongoing trend of capital concentration, with large well known infrastructure managers raising larger funds than before which has often led to a deterioration in terms and worsening alignment with investors. A ging number of large asset owners in Australia continue to invest directly in infrastructure by forming club deals and JVs which allows them to structure investments in a more cost-efficient way and have more control over their strategy.”
According to the latest data in the research, Bridgewater Associates is the largest manager in terms of overall assets under management, with over $116 billion invested in direct hedge funds. TH Real Estate – an affiliate of Nuveen, the investment management arm of TIAA – is the largest real estate manager globally, overseeing more than $105 billion in assets, whilst Blackstone continues to look after the highest volume of private equity and FoHF assets at just over $100 billion and $71 billion respectively. Prudential Private Placement Investors is the most significant illiquid credit manager with nearly $81 billion under management.
Table 1. The top 25 ranking of alternative asset managers
| Rank | Name of parent organisation | Country | AuM US$million | Asset Class |
|---|---|---|---|---|
| 1 | Bridgewater Associates | United States | 116,764.20 | Direct Hedge Funds |
| 2 | TH Real Estate (1) | United States | 105,488.98 | Real Estate Strategies |
| 3 | Blackstone | United States | 101,963.00 | Real Estate Strategies |
| 4 | Blackstone | United States | 100,192.00 | Direct Private Equity |
| 5 | Macquarie Group | Australia | 96,161.72 | Direct Infrastructure Funds |
| 6 | PGIM (2) | United States | 94,583.99 | Real Estate Strategies |
| 7 | Prudential Private Placement Investors | United States | 80,860.40 | Illiquid Credit |
| 8 | CBRE Global Investors | United States | 78,200.00 | Real Estate Strategies |
| 9 | UBS Asset Management | Switzerland | 78,031.00 | Real Estate Strategies |
| 10 | TPG Capital** | United States | 72,000.00 | Direct Private Equity Funds |
| 11 | Blackstone | United States | 71,119.70 | Funds of Hedge Funds |
| 12 | AQR Capital Management | United States | 69,175.00 | Direct Hedge Funds |
| 13 | J.P. Morgan Asset Management | United States | 61,346.40 | Real Estate Strategies |
| 14 | Principal Global Investors | United States | 60,640.00 | Real Estate Strategies |
| 15 | Kohlberg Kravis Roberts & Co. | United States | 58,398.80 | Direct Private Equity Funds |
| 16 | AXA Investment Managers | France | 56,506.60 | Real Estate Strategies |
| 17 | Man Group | United Kingdom | 54,668.00 | Direct Hedge Funds |
| 18 | Brookfield Asset Management | Canada | 54,642.00 | Real Estate Strategies |
| 19 | Hines | United States | 54,004.00 | Real Estate Strategies |
| 20 | LaSalle Investment Management | United States | 53,160.00 | Real Estate Strategies |
| 21 | Goldman Sachs Asset Management | United States | 52,183.34 | Private Equity FoF |
| 22 | AEW (3) | United States | 50,996.00 | Real Estate Strategies |
| 23 | The Carlyle Group** | United States | 50,864.00 | Direct Private Equity Funds |
| 24 | Providence Equity Partners** | United States | 50,000.00 | Direct Private Equity Funds |
| 25 | Advent International | United Kingdom | 48,932.00 | Direct Private Equity Funds |
* Data derived from the Global Billion Dollar Club, published by HedgeFund Intelligence
**Figures show total assets under management, obtained from publicly available sources
(1) TH Real Estate is an affiliate of Nuveen (the investment management arm of TIAA)
(2) The assets reported here reflect those of the PGIM Real Estate and PGIM Real Estate Finance divisions
(3) AEW Capital Management is an affiliated investment management firm of Natixis Global Asset Management, thus contributing to the illustration of Natixis' overall capabilities in global alternative offerings
Table 2. The top 25 Australian managers in the Global Alternatives Survey by asset class
| Rank | Global rank | Name of parent organisation | AuM US$million | Asset Class |
|---|---|---|---|---|
| 1 | 5 | Macquarie Group | 96,161.72 | Direct Infrastructure Funds |
| 2 | 82 | IFM Investors | 24,893.00 | Direct Infrastructure Funds |
| 3 | 112 | Platinum Asset Management | 18,000.00 | Direct Hedge Funds |
| 4 | 121 | AMP Capital | 16,068.00 | Real Estate Strategies |
| 5 | 150 | Lend Lease | 13,017.00 | Real Estate Strategies |
| 6 | 158 | First State Investments | 12,780.52 | Direct Infrastructure Funds |
| 7 | 159 | DEXUS Property Group | 12,309.17 | Real Estate Strategies |
| 8 | 184 | QIC | 10,495.09 | Real Estate Strategies |
| 9 | 202 | ISPT | 9,582.00 | Real Estate Strategies |
| 10 | 207 | AMP Capital | 9,321.88 | Direct Infrastructure Funds |
| 11 | 234 | Hastings Funds Management | 7,277.13 | Direct Infrastructure Funds |
| 12 | 245 | QIC | 6,594.84 | Direct Infrastructure Funds |
| 13 | 249 | The GPT Group | 6,229.34 | Real Estate Strategies |
| 14 | 275 | Magellan Asset Management | 5,071.30 | Direct Infrastructure Funds |
| 15 | 310 | Macquarie Group | 3,711.98 | Real Estate Strategies |
| 16 | 339 | Macquarie Group | 3,074.00 | Illiquid Credit |
| 17 | 342 | Macquarie Group | 3,031.46 | Direct Hedge Funds |
| 18 | 352 | Whitehelm Capital | 2,737.06 | Direct Infrastructure Funds |
| 19 | 358 | Investa Property Group | 2,532.85 | Real Estate Strategies |
| 20 | 365 | QIC | 2,351.46 | Private Equity FoF |
| 21 | 386 | Stafford Capital Partners | 2,006.20 | Natural Resources |
| 22 | 388 | New Forests Asset Management | 1,981.90 | Natural Resources |
| 23 | 389 | Hastings Funds Management | 1,980.46 | Illiquid Credit |
| 24 | 413 | Palisade Investment Partners | 1,676.00 | Direct Infrastructure Funds |
| 25 | 425 | Blue Sky Alternative Investments | 1,416.75 | Real Estate Strategies |
Figure 1. Overall survey statistics
* Figures for some of these managers were obtained from publicly available sources and using data derived from the Global Billion Dollar Club, published by HedgeFund Intelligence
Notes to editors
Willis Towers Watson conducted this survey for the year to December 2016 to rank the largest alternative investment managers and includes 562 investment manager entries comprising: 121 in hedge funds, 102 in real estate, 75 in private equity, 60 in illiquid credit, 58 in infrastructure, 46 in private equity fund of funds, 39 in fund of hedge funds, 23 in commodities, 22 in natural resources and 16 in insurance-linked investments. For real estate, commodities and infrastructure, individual managers are included. The majority of the data comes directly from investment managers with the remainder coming from publicly available sources. Certain individual hedge fund information was sourced from the Global Billion Dollar Club, published by Hedge Fund Intelligence. All figures are in US$.
About Willis Towers Watson Investment
Willis Towers Watson’s Investment business is focused on creating financial value for institutional investors through its expertise in risk assessment, strategic asset allocation, fiduciary management and investment manager selection. It has over 900 colleagues worldwide, assets under advisory of over US$2.3 trillion and over US$87 billion of assets under management.
About Willis Towers Watson
Willis Towers Watson (NASDAQ: WLTW) is a leading global advisory, broking and solutions company that helps clients around the world turn risk into a path for gth. With roots dating to 1828, Willis Towers Watson has 40,000 employees serving more than 140 countries. We design and deliver solutions that manage risk, optimize benefits, cultivate talent, and expand the power of capital to protect and strengthen institutions and individuals. Our unique perspective allows us to see the critical intersections between talent, assets and ideas – the dynamic formula that drives business performance. Together, we unlock potential.
