main content, press tab to continue
Article | WTW Research Network Newsletter

Worlds apart: Implications of the 2023 Mw 7.8 and Mw 7.5 Kahramanmaraş, Türkiye, earthquakes for California

By Ross S. Stein , Volkan Sevilgen , Ali Özbakir , Shinji Toda, IRIDeS and Hector Gonzales-Huizar | July 20, 2023

The earthquakes took the lives of 53,000 people, left 2 million people homeless, and will cost an estimated $34 billion to recover from the damage.
Environmental Risks|Aerospace|Climate|Facultative|Insurance Consulting and Technology|Investments|Marine
Climate Risk and Resilience|Insurer Solutions

Among the many tragic and alarming elements of the Türkiye earthquakes are some that could befall California. These include the possibility of great events on secondary faults, interacting mainshocks that impact buildings twice, and the likelihood of extreme shaking near the rupture and in deep basins.

Progressive mainshocks and earthquake interaction On 6 February a Mw 7.8 earthquake struck southern and central Türkiye and northern and western Syria, followed by a Mw 7.5 shock on a different fault 9 hours later and 100 km away. Surely this is rare?

No, it is not. Seismologists like telling us that the largest aftershock is about one magnitude unit smaller than the mainshock, but earthquakes don’t follow our rules; instead, they are often part of a chain reaction. Examples abound of mainshocks striking within hours to months of each other, including the 1811-1812 Mw 7.2, 7.0, 7.4 New Madrid, Missouri, quakes several months apart; the 1992 Mw 7.3 Landers and Mw 6.5 Big Bear, California, shocks 3 hours apart; the 2002 Mw 6.6 and Mw 7.9 Denali, Alaska, quakes 10 days apart, and the 2019 Mw 6.4 and Mw 7.1 Ridgecrest, California, quakes 31 hours apart[1]. In fact progressive or compound mainshocks are not restricted to any region or tectonic setting.

There are two implications of earthquake interaction

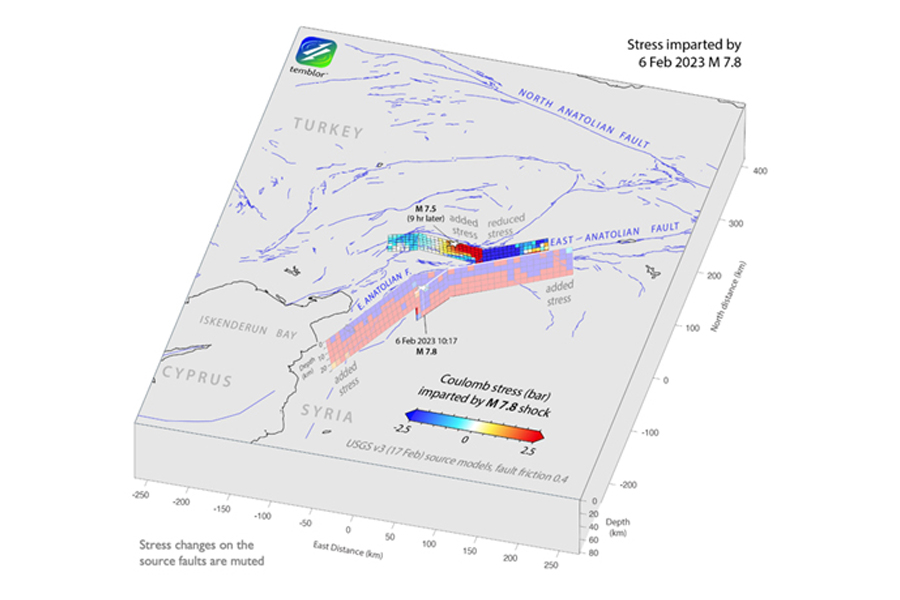
  1. The good news is that by calculating the ‘Coulomb stress’ transferred by a mainshock to the surrounding region, one can identify the faults brought closer to failure, and those brought farther from failure (Figure 1). In some places, the hazard rises; in others, it drops. This is what Temblor’s Realtime Risk technology (whose development was supported by the WTW Research Network), does: once a large quake strikes, the hazard changes, which models need to capture so that next year's risk is reflected in models. This is in contrast to conventional earthquake risk models, which do not take stress interaction into consideration.
  2. The bad news is that buildings damaged in the first shock can collapse in the second, which the ‘hours clause’ in insurance contracts does a poor job of accounting for. Think of the many horrifying building collapse videos of the Türkiye quake we saw, filmed in daylight. The first quake struck in the dark, at 4 am local time, and so most of the videoed collapses occurred during the second shock, with the buildings succumbing to a ‘one-two punch.’ Trying to account for this dynamic accumulation of damage in fragility and vulnerability models is an active area of research[3].
Figure 1. Coulomb stress imparted by Mw 7.8 rupture to Cardak-Sürgü Faults, ruptured 9 hours later. Stress promoting failure is concentrated near where Mw 7.5 nucleated, suggesting first shock promoted or triggered second.
Figure 1. Coulomb stress imparted by the Mw 7.8 rupture to the Cardak-Sürgü Faults, which would rupture 9 hours later. Stress promoting failure (red patches) is concentrated near where the Mw 7.5 nucleated, which suggests that the first shock promoted or triggered the second.

Source : From Stein et al. (2023)[2].

Extreme shaking close to the fault rupture

It has been widely reported that collusion between builders and inspectors, and code compliance amnesties issued by the government[4] [5], were the largest contributors to the 35,000 building collapses, the additional 18,000 slated for demolition, and the 180,000 buildings heavily damaged[6]. But that is not the whole story.

The sad truth is that shaking at frequencies that attack 6-10-story buildings, which typify many cities, often exceeded the most stringent building code requirement in Türkiye (the ‘2% in 50-year’ ground motion, which translates into a 2500-year return time)[4].

The Mw 7.8 Kahramanmaraş event is by far the best-recorded earthquake the world has ever known. Although Japan’s strong motion network is unrivaled, and the 2011 Mw 9.0 Tohoku shock was much larger, the megathrust event struck 80 km offshore. In contrast, there are about 50 stations within 25 km of the 2023 rupture, seven of which recorded Peak Ground Accelerations (PGA) in excess of 1 g (Figure 2). This extreme near-fault shaking would likely occur during quakes of similar size in California, such as on the San Andreas or Hayward Faults. But until now, there was little or no data to anticipate such shaking. This means buildings close to the rupture could fare worse than expected in current models, and that U.S. building codes may need revision to account for this effect.

Figure 2. Image showing there are about 25 observations of Peak Ground Acceleration (PGA) exceeding 0.5 g. At this level of shaking, all but most resilient buildings generally suffer structural damage. Temblor Ground Motion Model capturing this shaking at distances of 10-400 km from fault rupture.
Figure 2. There are about 25 observations (red) of Peak Ground Acceleration (PGA) exceeding 0.5 g. At this level of shaking, all but the most resilient buildings generally suffer structural damage. The Temblor Ground Motion Model (blue) does a good job of capturing this shaking at distances of 10-400 km from the fault rupture.

Building collapses concentrated in areas of high site amplification

The inventory of collapsed Turkish buildings, compiled from satellite imagery (Humanitarian Open Street Map Team, 2023)[7], furnishes an unmatched dataset to study collapse. This scientific gift came at a terrible cost, so we must use it wisely.

Our preliminary analysis reveals that collapse is highly correlated with site amplification, as seen in the 100m resolution Temblor model, STAMP (Figure 3). The collapse rate in flat areas underlain by soft sediments is much higher than elsewhere.

Because nearly identical buildings likely built at the same time by the same builder span regions with high and low site amplification, we can often control for other factors, and conclude that site amplification is of primary importance in assessing risk. In contrast, while liquefaction and landslides occurred, they were less influential for collapse.

Figure 3. Collapsed buildings tend to be concentrated in regions modeled to have high site amplification. Temblor STAMP model is based on features of the relief, where flat areas are likely sedimentary basins and areas with more relief are sites of bedrock.
Figure 3. Collapsed buildings tend to be concentrated in regions modeled to have high site amplification. The Temblor STAMP model is based on features of the relief, in which flat areas are likely sedimentary basins (orange), and areas with more relief are sites of bedrock (blue).

Ominous similarities between faults in Eastern Türkiye and California

The North Anatolian and San Andreas Faults are remarkably similar in length, slip rate and earthquake history (Figure 4); both have experienced Mw 7.8 shocks in the past 170 years. The East Anatolian Fault resembles the Hayward-Rodgers Creek Fault in northern California, the San Gregorio along the central coast, the Owens Valley-Inyo Fault in eastern California, and the San Jacinto in southern California. So, those faults should have Mw 7.8 shocks in any stochastic event set one is using. The Cardak-Sürgü Fault closely resembles the Garlock Fault in southern California. Both are so misaligned for the tectonic stresses that they must be very slippery to move at all. But despite that misalignment, we should assume that the Garlock Fault, which abuts the San Andreas, is capable of a Mw≥7.5 event.

The most important lesson is that the Türkiye quakes did not strike on the equivalent of the mighty San Andreas Fault, but instead on shorter, low-slip-rate faults that are often deemed incapable of quakes of this great size. The East Anatolian Fault is 600 km long with a slip rate of ~10 mm/yr, and the Cardak-Sürgü Fault is 200 km long with a slip rate of ~3 mm/yr; both can be considered part of the broad East Anatolian Fault Zone.

The Mw 7.8 earthquake nucleated on the minor, 20-km-long Narlı Fault, and then jumped onto the East Anatolian Fault, propagating in both directions (SW and NE), ultimately attaining a rupture length of 300 km with ~4.5 m average slip. The Mw 7.5 shock nucleated on the Cardak Fault, and also ruptured in both directions. To the east, it jumped onto the Sürgü Fault, attaining a 150-km total length and ~7 m average slip. So, surprisingly, the slower, shorter fault had the highest slip. Even stranger, the Cardak-Sürgü Fault shouldn’t slip at all; it is misaligned for failure.

It was formerly a ‘right-lateral’ fault (whichever side you are on, the other side moves to the right) that only recently became left-lateral (this switch is called ‘inversion’ by geologists).

So, the key question is, are we prepared for Mw 7.8 and Mw 7.5 shocks on their California equivalent? The answer is probably no, because we’ve focused on events with repeat times of 500 years or less. Instead, Temblor’s event set yields an 1800-2000 year repeat time for quakes in this Zone.

What’s essential is to harness these hard- won insights from Türkiye to better forecast seismic risk, and better prepare for its consequences in California and elsewhere, where much of what we have just witnessed can also occur.

Footnotes

  1. Toda, S. & Stein, R. S. Long and short-term stress interaction of the 2019 Ridgecrest sequence and Coulomb-based earthquake forecast. Bulletin of the Seismological Society of America 110, 1765–1780 (2020). Return to article
  2. Stein, R.S., Toda, S., Özbakir, A. D., Sevilgen, V., Gonzalez-Huizar, H., Lotto, G., Sevilgen, S. 2023, Interactions, stress changes, mysteries, and partial forecasts of the 2023 Kahramanmaraş, Türkiye, earthquakes. Temblor. (2023) Return to article
  3. Lacoletti, S., Cremen, G. & Galasso, C. Modeling damage accumulation during ground-motion sequences for portfolio seismic loss assessments. Soil Dynamics and Earthquake Engineering 168, 107821 (2023) Return to article
  4. Erdik, M., Tümsa, M. B. D., Pınar, A., Altunel, E., and Zülfikar, A. C. A preliminary report on the February 6, 2023 earthquakes in Türkiye. Temblor. A preliminary report on the February 6, 2023 earthquakes in Türkiye (2023). Return to article
  5. Yeginsu, C., Ruiz, R. & Kirac, N. Earthquake-Proof, Not Corruption-Proof: Turkey's Needless Deaths, New York Times, 4 May edition, Earthquake-Proof, Not Corruption-Proof: Turkey’s Needless Death (2023). Return to article
  6. Statistics from the 9 May 2023 Earthquake Engineering Research Institute (EERI) ‘Learning From Earthquakes’ webinar. Return to article
  7. Humanitarian Open Street Map Team, HOTOSM Turkey Destroyed Buildings (OpenStreetMap Export), HOTOSM Turkey Destroyed Buildings (OpenStreetMap Export) (2023). Return to article
Download
Title File Type File Size
Natural Catastrophe Review January - June 2023 PDF 5.5 MB
Authors

Temblor, Inc.

Temblor, Inc.

Temblor, Inc.

Tohoku University, Japan


Contact us