Observational records yield only loose constraints of possible natural hazards. By exploiting large ensembles of hazard data, we can increase confidence and understanding of probable tail risk.
The usual understanding of the risk posed to a certain region from a given hazard is often heavily influenced by its historical record. Real-world events allow us to directly study their impacts and financial implications. From this, we know that it is possible to have very active North Atlantic hurricane seasons, such as 2005[1] (15 hurricanes, 7 major). Likewise, the European windstorm record shows that events causing insured losses exceeding €5 billion are entirely plausible,[2] as seen during Storm Lothar in 1999.
Despite these high impact and often devastating events, it is likely that even more intense, more damaging, and consequential events are possible – even under the conditions of the present day and historical climates – meaning that the events insurers and reinsurers price and capitalize against may represent only a subset of what is physically possible.
Why the observational record is not enough
Observed events represent just one possible realization of the climate system. Small changes in historical atmospheric conditions could have led to different storm tracks, intensities, and impacts. In other words, the historical record contains only one sample from a much wider range of plausible outcomes, with internal variability (“chaos”) strongly influencing which events do and do not occur.
Given the current climate state, we can derive estimates such as the 1-in-200-year wind gust for a given location. However, these estimates are highly uncertain because the observed record contains very few tail events, meaning that risk in some regions may be under- or over-estimated.
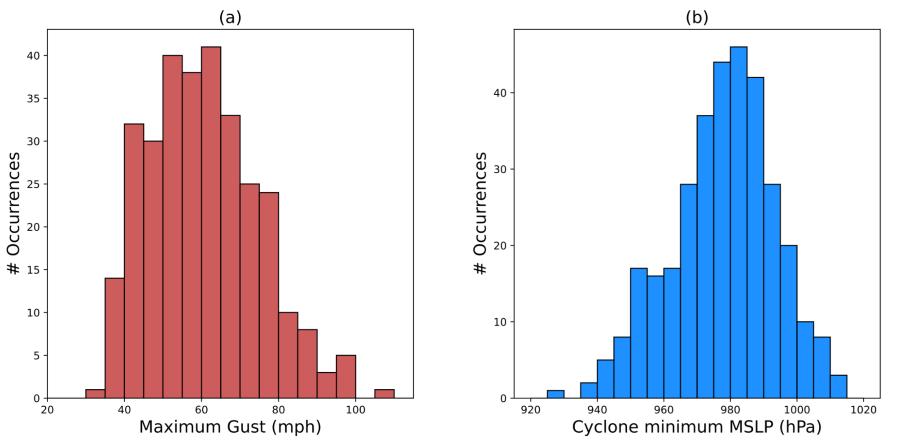
For example, Figure 1 shows that between 1979 and 2020 there are only a limited number of European windstorms with wind gusts exceeding 80 miles per hour (mph)[3] (Figure 1a). Only nine cyclones generated maximum gusts above 90 mph, suggesting an estimated return period of roughly 4.5 years for a 90 mph windstorm. Likewise, just 16 cyclones with a minimum mean sea level pressure (MSLP) below 950 hectopascals (hPa) have passed directly over the UK and Ireland (Figure 1b), implying an event of this magnitude occurs approximately every 2.5 years. These estimates, however, are based on a relatively small sample of events.
Figure 1. Quantification of cyclones directly passing over the UK.
(a) Distribution of cyclone maximum gust over land and (b) cyclone minimum MSLP. Data is from winter (December-January-February) 1979-2020.
For the (re)insurance industry to better understand true European windstorm risk at long return periods, we need to extend the effective historical record beyond the current ~50 years. Large ensembles of weather simulations allow us to do this. By increasing sample sizes by at least an order of magnitude, we can explore a larger sample of extreme events and go well beyond the observed limits.
What are large ensembles?
To extend the information available beyond the limited historical record, we turn to large ensembles of weather simulations. Large ensembles are mathematical simulations of the earth system that come from multiple physics-based models run many times to capture the uncertainty and sample the range of variability in the climate system. A common approach is to use ensembles of seasonal forecast model data. This is commonly referred to as the UNSEEN approach following the initial use of seasonal forecasts in this technique by Thompson et al. (2017).[4] The ensembles represent many physically consistent simulations of the historical climate state, each providing a different plausible realization of the same background conditions. These models are initialized each month, run for 6-7 months, and have ensemble sizes of 25-50 members per month of initialization. Therefore, many samples of present-day atmosphere-ocean variability can be captured. In addition, they do not develop the large long-term model errors that grow in ensembles of free-running climate model simulations.
The benefits to this approach extend beyond the large sample size of data. These are physically consistent and physically plausible realizations of the weather and climate, with no statistical extrapolation being required to investigate events at the 1-in-1000-year return level. This means that associated meteorology, remote drivers, and dynamics of hazards can be investigated to allow further contextualization of these high impact events.
This approach has already offered improved quantifications of hazards, such as the probability of 40°C days in the UK[5] (for which we have an observed sample of just one), extended wind droughts in the North Sea,[6] extreme precipitation in UK summers,[7] unprecedented monsoons,[8] and extreme heat events in the Nordic Countries.[9]
Implications for (re)insurance
For the insurance sector, large-ensemble approaches offer a powerful way to move beyond the limitations of the historical record. By exploring thousands of physically plausible but unobserved weather events, they can strengthen how we understand, quantify, and manage wind risk in three key ways:
01
Stress-testing catastrophe models
Large ensembles provide a broader set of plausible extremes against which to test vendor or in-house model tails. This helps identify whether current model assumptions capture the full spectrum of potential storm intensities and loss drivers.
02
Improving confidence in long-return-period losses
By increasing the number of severe but rare events, large ensembles reduce statistical uncertainty in estimates such as the 1-in-100 or 1-in-200-year loss, improving the robustness of capital modelling and reinsurance pricing.
03
Identifying hidden concentrations of risk
By revealing events more extreme than any observed, large ensembles expose where losses could accumulate under conditions that haven’t yet occurred. This helps insurers identify potential aggregation hotspots and challenge assumptions about geographical diversification.
Evidence for more extreme storms
As part of the research partnership between the University of Exeter and the Willis Research Network, efforts are being focused on understanding unprecedented extreme European windstorm events by using these large ensemble simulations.
Initial findings from a 1200-year ensemble reveal storms impacting the UK and Ireland can exceed anything seen in the modern record:
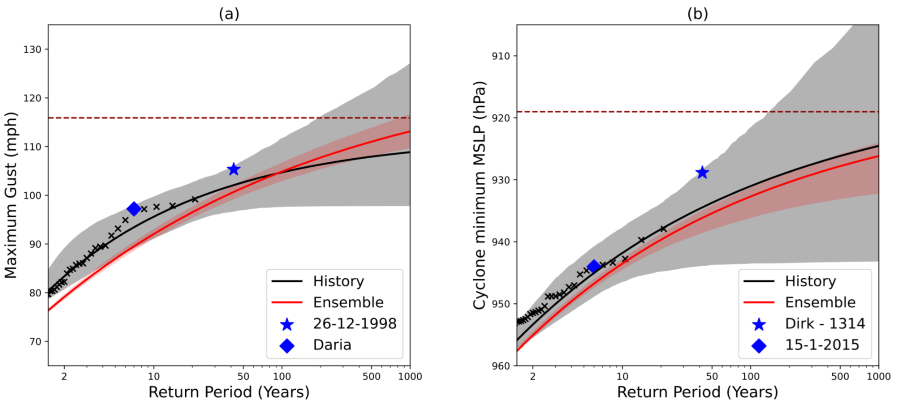
Stronger wind gusts: Simulated maximum land gusts reach 116 mph in the 1,200-year ensemble – around 11 mph higher than the strongest observed event (105 mph; Stephen – 26/12/1998). This increase is broadly equivalent to moving from a Category 2 to a Category 3 hurricane on the Saffir-Simpson scale. The expanded dataset also reduces uncertainty in the 1-in-100-year gust estimate by more than a factor of four (Figure 2a).
Deeper low-pressure systems: Cyclones with simulated minimum MSLP lower than 920 hPa appear in the ensemble, far deeper than anything observed over the UK or Ireland. Cyclones of this intensity are typically found near Iceland, approaching the strength of the most intense North Atlantic cyclone on record (1993 Braer Storm, 914 hPa). Using the ensemble, the estimated 1-in-100-year cyclone intensity range narrows from 922–944 hPa in the observations to 932–937 hPa (Figure 2b).
Improved event benchmarking: Storm Daria had the 5th strongest peak gust in the historical record (97.2 mph; Figure 2a). In our model ensemble a gust of at least this strength would have a return period of ~22 years (95% confidence of 19-28 years).
Taken together, these results provide a physically consistent window into events more intense than the recent historical record, while also improving confidence in existing return-period estimates. This offers insurers and reinsurers a firmer basis for assessing the true limits of today’s European wind risk.
As part of this partnership, future activities will continue to explore these extreme, and very rare events, examining the driving meteorology and dynamics, and focus on understanding the dominant drivers and modes of variability modulating the occurrence of such events so that unprecedented storms and periods of intense storm activity may be better understood and better anticipated.
Figure 2. Return levels of (a) cyclone gust over land for the UK and Ireland and (b) cyclone minimum MSLP. Black crosses are data from ERA5.
Black solid line and shading is a generalized pareto distribution fit to the historical data, with red line and shading being the same from the ensemble simulation. Blue diamonds represent the strongest historical events, with blue diamonds being other notable events. The red dashed line is the strongest event from the ensemble simulation.