


In Asia Pacific, AI is accelerating and reshaping the fundamental architecture of how organisations compete for talent and reward leadership. For HR and reward leaders across the region, the question is no longer whether to respond, but how quickly and strategically can this be done.
The numbers reflect this momentum. Total investment in AI by Asia Pacific organisations is projected to reach $175 billion by 2028, growing at a compound annual rate of 33.6% from 2023 to 2028. Most leaders (53%) in the region are already deploying AI agents to fully automate business processes, while the global average is still the minority at 46%. These are not exploratory pilots. These numbers[1] are operational realities and they are changing what organisations need from their people.
The tech talent landscape, particularly, is subjected to these changes. Now more than ever, Asia Pacific organisations are looking for people who can effectively integrate AI across a wide range of business purposes.
A closer look at the AI talent landscape
Technology, media and gaming (TMG) accounts for 55% of the AI talent pool across Asia Pacific, but demand is spreading rapidly into general industry and manufacturing (16%), financial services (12%), biopharma and life sciences (7%), and retail (7%). This broadening means organisations across industries are competing for the same high-value skills, and this competition is only going to increase.
What makes the Asia Pacific picture especially nuanced is how AI talent structures are shifting to differ meaningfully across markets, each reflecting distinct business priorities (Figure 1).
In China, we see a mid- to senior-heavy profile (concentrated at the P3/P2 levels for IT development roles) consistent with the country’s aggressive domestic AI investment agenda. India presents a different picture: a larger junior- to mid-base (P1/P2) that reflects scale-focused talent pipelines and a deliberate emphasis on building foundational AI capabilities across a broad workforce. Singapore’s AI talent is concentrated at mid-senior levels, aligned with enterprise AI adoption and advanced applications, while Taiwan’s P2-dominant profile reflects its industrial automation and semiconductor manufacturing depth.
These structural differences are not incidental. They are strategic expressions of where each market is in its AI journey and understanding them is essential for any organisation designing talent pipelines or calibrating pay across the region.
Compensation as a competitive signal
Rising AI demand is translating directly into compensation pressure. China and Singapore offer the highest AI compensation packages in Asia Pacific, with pay for roles at the P4 level reaching 60% and 59% of total compensation respectively, despite both markets trailing U.S. benchmarks by roughly 40%. The pay gap between AI roles and general professional positions has narrowed significantly, signaling that the competition for AI talent is increasingly global in nature.
Two other markets also deserve close attention. Japan has historically been treated as a relatively stable, slow-moving compensation environment, but that assumption no longer holds. Domestic companies have driven wage increases from just 1.8% in 2021 to 5.3% in 2025, overtaking foreign-firm medians for the first time in 2023.
Meanwhile, South Korea presents a different kind of structural story. Salary increase rates are moderating by moving from 4.5% to 4.2%, but more significant change is happening at the HR architecture level. This is indicative of a recalibrating HR system, as evidenced by moving away from seniority-based pay, the extension of the retirement age to 65 by 2030 and a broader shift towards 4.5-day workweeks.
Using workforce analytics to build an optimal talent structure
Understanding where the market is moving is only half the equation. To adapt to the shifting landscape, organisations need to review their workforce analytics and its key metrics. These metrics fall into four interconnected categories (Figure 2).
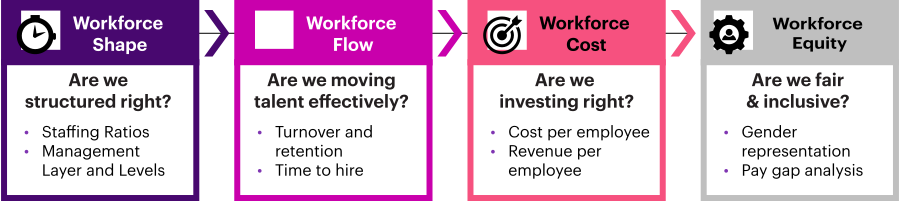
Figure 2. Metrics that matter: From data to decisions
These metrics let organisations know their current workforce structure, the status of attraction and retention as well as the revenue per employee. Revenue per employee is a particularly telling indicator, as higher performance on this measure points to better resource utilisation, improved profitability and operational sustainability that supports long-term growth.
Aggregate data from our Asia Pacific workforce analytics data from 2024 to 2026 also reveals an interesting pattern (Figure 3). The professional core (experienced individual contributors) remained stable at around 55% throughout this period, which reflects deliberate focus on experienced talent as businesses scale operations, including AI-driven ones. Meanwhile, combined support layers have compressed from approximately 20.9% to 17.2%, which is a clear signal that role-based support is giving way to platform-enabled support, driven by automation, shared services and standardised tooling.
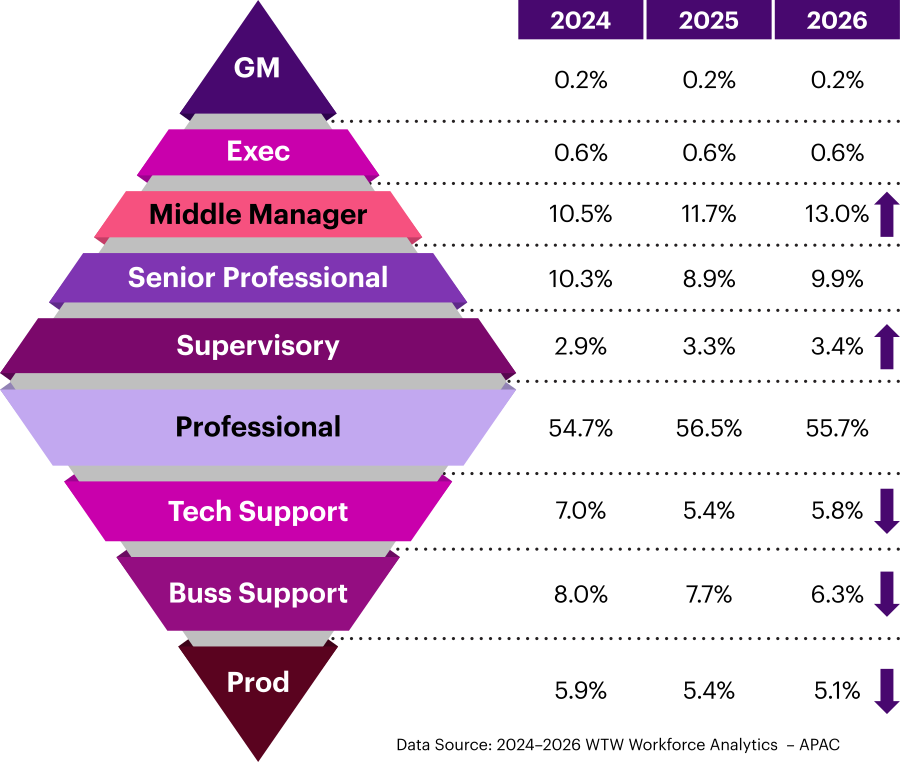
Figure 3. Shape analysis of talent structure in Asia Pacific organisations from 2024 to 2026
The most strategically interesting shift is upward: middle management layers have grown from 10.5% to 13.0% and supervisory layers from 2.9% to 3.4%. This is intentional. Organisations are moving away from the flat structures and adding capacity for execution leadership — focusing on delivery management, stakeholder alignment, performance and capability building. The resulting shape is stable at the core, rationalising at the base and investing in people management in the middle. The shape represents a transition from a flatter, function-led model towards a scalable operating model across teams.
The shape of your workforce structure tells a story about your current priorities. Using diagnostic tools, reliable data and resources, such as WTW’s workforce analytics tools and salary survey reports, can guide you in making decisions that are aligned with your business.
Building strategic alignment
These trends mean that the cadence of review for workforce design and compensation programs needs to accelerate in Asia Pacific. This will allow organisations to keep up with the pace of AI adoption, talent competition and market fluctuations.
Workforce structure and compensation are, at their core, two expressions of the same organisational strategy. The way a company shapes its workforce (where it adds coordination layers, where it compresses support, where it invests in AI talent) should align with how it rewards its people. Organisations that integrate these strategic levers coherently will be better positioned to scale operations, compete for talent needed for AI-driven growth and maintain flexibility. The availability of comprehensive data and workforce analytics is key in developing rewards strategies that adapt to the shifting talent landscape while also aligning with business objectives.
Data sources:
- IDC Worldwide AI and Generative AI Spending Guide, WTW Research, public information. Return to article
Authors


Beyond Data on-demand webinar
Navigating change – Insights on pay, workforce strategy and board governance