main content, press tab to continue
Article

How to predict a riot: Developing risk-based loss models for social unrest

By Weimeng Yeo and Tim Brewer | June 10, 2025

Civil unrest events, driven by factors like inequality and political polarization, have surged in both frequency and intensity in recent years.
Crisis Management|Risk and Analytics
N/A

Introduction

Civil unrest events, driven by factors like inequality and political polarization, have surged in both frequency and intensity in recent years, resulting in a 3000% increase in claims under so-called Strikes, Riots, and Civil Commotion (SRCC) coverages[1]. This sharp rise has pushed the insurance industry to refine their risk assessments to better anticipate losses. However, traditional risk models often fall short of capturing the evolving nature of civil unrest. This article explores how advancements in analytics can improve the prediction of riots and civil unrest, enhancing risk management strategies to reduce financial impacts.

Underlying patterns

While riots may sometimes seem spontaneous, research suggests they are often influenced by underlying factors. Key predictive indicators include:

Economic inequality

Countries with stark income inequality tend to experience more civil unrest. The two costliest episodes since 2020 occurred in the first and third most unequal countries by Gini index[2]: South Africa suffered $1.7 billion in insured losses during the 2021 riots[3], while Colombia faced claims well into the hundreds of millions of dollars in the same year.

As inequality rises, the likelihood of civil unrest may increase[4].

Political representation gaps

Government distrust and political disillusionment drive growing grievances and unrest. The 2025 Edelman Trust Barometer shows government is distrusted in 17 of 28 countries, and over half of young people support hostile activism, including violence. This disconnect increases the likelihood of protests and extreme actions[5].

Digital connectivity

Urban centers with high social media penetration see faster protest mobilization, amplifying unrest. The 2019 Chilean riots illustrate this, as calls to action spread rapidly online, turning a subway fare protest into nationwide demonstrations[6].

According to the Carnegie Endowment for International Peace (CEIP), over 150 countries have experienced significant civil unrest since 2017, highlighting global trends of social and political unrest across various political systems and cultures, thus providing a rich dataset for identifying patterns[7]. These observed patterns suggest that insurers could enhance risk assessment models by considering factors beyond traditional geographic boundaries.

Common patterns and geographic concentration

While each outbreak of civil unrest is unique, identifiable patterns can often be observed. By analyzing historical incidents, certain high-risk conditions can be identified and protest epicenters predicted.

For instance, the 2020-2021 Black Lives Matter protests in the U.S., sparked by George Floyd’s killing, were centered in urban hubs and culturally significant locations[8]. In Portland, protests focused on the Mark O. Hatfield Federal Courthouse, while in Washington D.C., they concentrated around Lafayette Square[9]. These spaces were strategically chosen to draw media attention and highlight issues like police brutality and systemic racism.

The causes of civil unrest often influence its geographic concentration:

  • Ethnic or racial unrest may emerge in neighborhoods with larger populations from affected communities.
  • Political protests often focus on administrative centers, challenging power structures directly.
  • Economic protests may target financial districts or symbols of commerce.

Although unrest may initially spread unpredictably, its geographic reach is often influenced by law enforcement responses. The effectiveness of security forces can play a significant role in limiting the escalation of unrest, while disorganized or delayed responses could potentially allow it to spread. Protesters’ willingness to face arrest or injury also influences how events unfold.

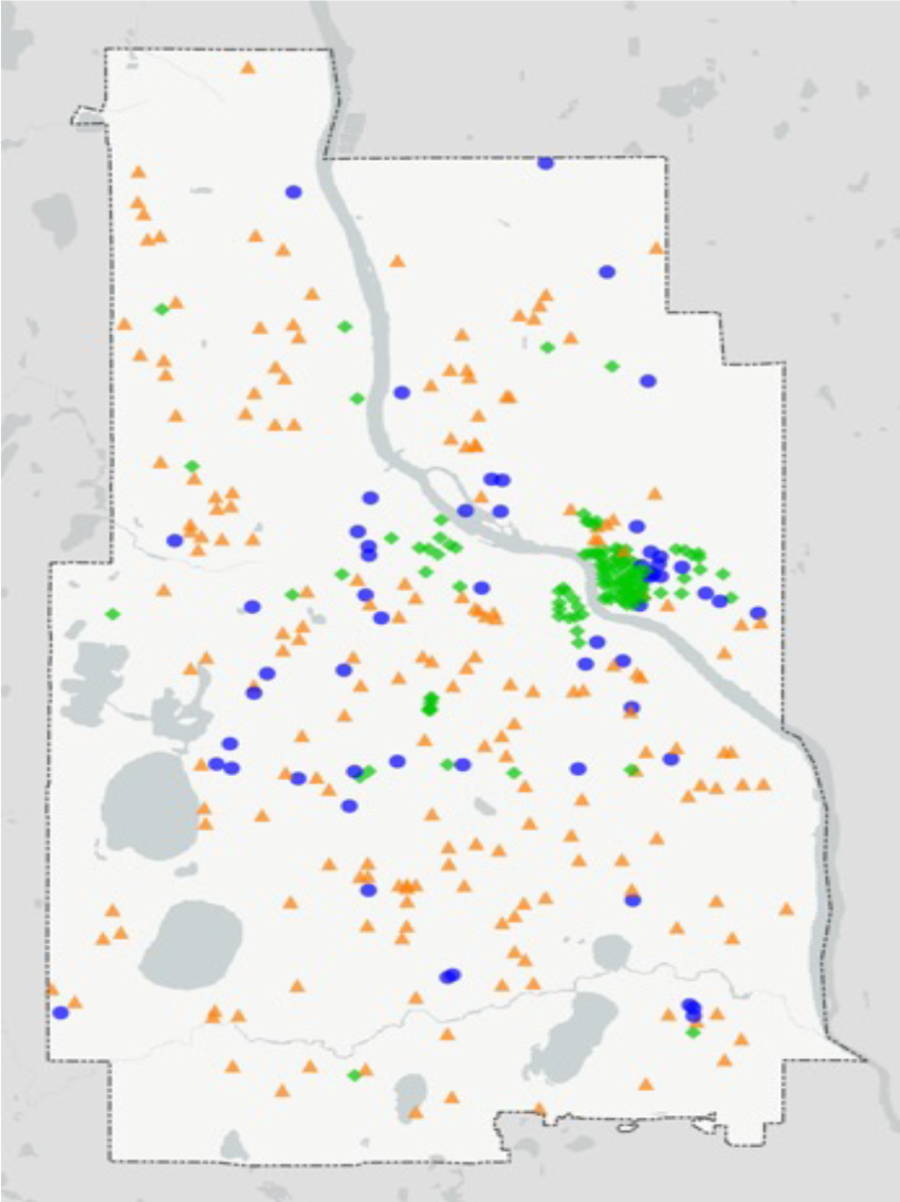
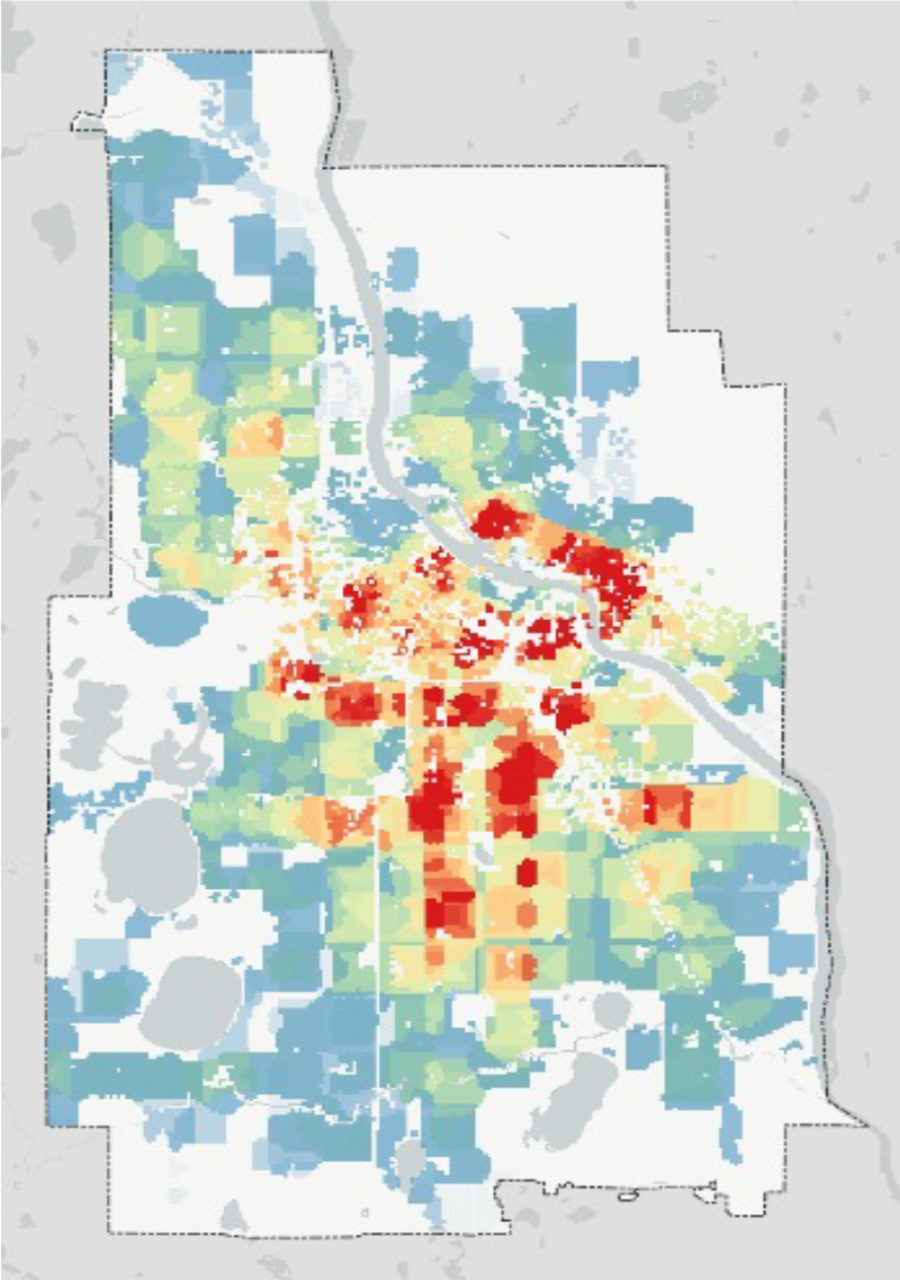
State of the art SRCC models, such as the Synthetik SRCC Quantum Tool, use spatial risk indicators, or ‘target points,’ to classify locations based on their role in civil unrest, including government buildings, financial institutions, or religious sites. This spatial approach allows insurers to assess SRCC risks with greater precision and nuance[10].

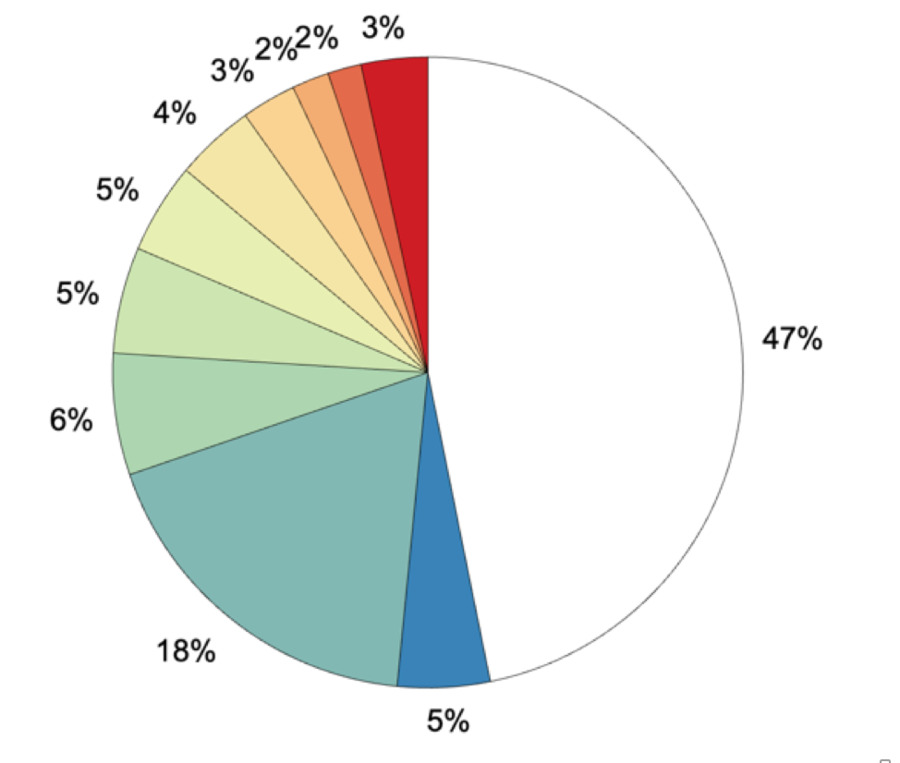
For example, according to Synthetik in 2020, only 3% of Minneapolis was classified as high-risk for an SRCC event. The model identified key target points across economic, religious, and political categories, allowing for a more precise mapping of risk distribution.

Map of Minneapolis - 374 SRCC Target Points identified
Figure 1: Screenshots taken from the Synthetik SRCC Quantum Tool, demonstrating simulations of SRCC risk across various regions

374 SRCC Target Points identified in Minneapolis (blue – economic, orange – religious, green – political)

SRCC Risk Map for Minneapolis
Pie chart to show the proportion of the Minneapolis land area by SRCC risk classification
Proportion of the Minneapolis land area by SRCC risk classification
Only 3% of Minneapolis is at HIGH risk of an SRCC event

Sources: Screenshots from Synthetik SRCC Quantum Tool

The dynamics of riot contagion

Understanding riot contagion — how unrest spreads — is crucial to modeling. Traditional models emphasized geographic proximity, assuming unrest radiates outward from an epicenter. However, digital technology has transformed these dynamics. Social media platforms like X, Facebook, and encrypted apps such as WhatsApp and Telegram enable real-time coordination and rapid mobilization, allowing protests to ignite simultaneously in multiple locations rather than spreading gradually from a central point.

The 2024 anti-government protests in Kenya demonstrated this shift. Activists used social media to organize demonstrations against tax increases and corruption, with the hashtag #RejectFinanceBill2024 gaining significant traction on social media platforms[11]. When the government restricted internet access, protesters used VPNs and encrypted apps to maintain communication and coordinate their actions across the country[12]. Live-streamed police responses amplified the protests, drawing global attention. This case highlights how digital tools enable real-time, decentralized mobilization, transforming civil unrest dynamics. Rather than spreading outward in concentric rings, modern SRCC models recognize protests follow linear pathways — shaped by roads, symbolic targets, and law enforcement presence. Insurers must adapt by incorporating these patterns into predictive models, replacing outdated geographic assumptions.

Boiling point

Civil unrest risks are set to grow due to global challenges like climate change, resource constraints, and economic instability. Widening wealth gaps and declining institutional trust are likely to fuel future demonstrations and riots, pushing unrest beyond traditional flashpoints.

To address this, it is important that risk management professionals adopt proactive risk models that integrate historical data with social, political, and economic indicators. Key factors for future models include:

  • Demographic shifts: Understanding population changes can highlight areas of rising tension.
  • Regional stress points: Identifying regions prone to political or economic shocks.
  • Social media amplification: Tracking digital activity to forecast rapid protest mobilization.

Managing civil unrest risk requires a dynamic strategy. Unlike natural disasters, these events are influenced by ever-changing human behavior and law enforcement responses. To tackle this, any Probable Maximum Loss (PML) model must involve a combination of varying riot severities, durations, and intervention strategies.

According to the Synthetik Quantum SRCC model, for example, a 2020 Minneapolis study simulated over 1,000 civil unrest scenarios, estimating a maximum loss of $700 million affecting 1,773 properties[13]. The actual losses from the George Floyd protests were around $500 million, impacting just over 1,000 properties — a strong validation of the model's accuracy, and suggesting that losses may have been even higher under different circumstances.

Conclusion

As political volatility intensifies, modern modeling approaches — incorporating demographic shifts, digital contagion dynamics, and spatial risk indicators — will be essential for managing financial impacts. To navigate rising civil unrest risks, risk managers must move beyond reactive strategies and embrace sophisticated predictive models. Doing so empowers loss mitigation strategies and enables insurers and buyers to come to the negotiation table from a position of strength.

Sources

  1. Swiss Re. "Strikes, Riots, and Civil Commotion Solutions." Swiss Re, accessed March 11, 2025. Return to article
  2. "Gini Coefficient by Country," World Population Review, accessed March 12, 2025. Return to article
  3. "South Africa Riots to Cost Insurers $1.7 Billion as Claims Near 100,000," Claims Journal, September 9, 2021, accessed March 12, 2025. Return to article
  4. "Political Violence Market Faces Multi-Hundred Million Loss from Colombian Protests," Insurance Insider, accessed March 12, 2025. Return to article
  5. Richard Edelman, "The Precipice of a Grievance-Based Society," Time, accessed March 12, 2025. Return to article
  6. WTW, "How Technology Has Transformed Politics in Emerging Markets," Political Risk Index - Winter 2021, accessed March 12, 2025. Return to article
  7. Carnegie Endowment for International Peace (CEIP), "Global Protest Tracker," accessed March 11, 2025. Return to article
  8. BBC News, "Timeline of U.S. Protests After George Floyd's Death," for more information, accessed March 11, 2025. Return to article
  9. Ibid. Return to article
  10. Synthetik SRCC Quantum Tool developed by Synthetik Applied Technologies, which utilizes spatial risk indicators to assess civil unrest risk. For more details, see the model's technical documentation or Synthetik's official resources. Return to article
  11. Media Council of Kenya, Online Mobilisation Report: How Social Media Fueled Protests in Kenya, accessed March 12, 2025. Return to article
  12. Ibid. Return to article
  13. Loss analytics taken from the Synthetik SRCC Quantum Tool. Return to article

Authors


Head of Terrorism and Political Violence Analytics, Crisis Management
email Email


Contact


Richard Scurrell
Head of Special Crime and Broking, Crisis Management
email Email

Contact us