Extratropical cyclones are the dominant weather system during the European winter season, contributing to most of the observed precipitation (Hawcroft et al., 2012) and strong winds (Ulbrich et al., 2001). Also known as mid-latitude cyclones, these systems form when a cold, polar air mass collides with a warm, subtropical air mass. The horizontal temperature contrast creates a steep pressure gradient, which drives strong winds and stormy weather. These cyclones typically have a frontal structure, with warm and cold fronts extending out from the central low pressure. These storms have the potential to cause severe damage to infrastructure, agriculture, transport, and even result in loss of life (e.g., Browning, 2004; Schwierz et al., 2010; Kendon & McCarthy, 2015).
Catastrophe models have traditionally been used to estimate the risk posed by extreme wind events caused by extratropical cyclones on insurance portfolios. These models are typically based on extreme value statistics conditioned and calibrated on historical storms from numerical weather prediction and general circulation model simulations. However, the reliability of these models is limited by the quality and quantity of observational data, which only goes back 60 years. As a result, it is unlikely that the full variability of extratropical cyclone behaviour has been sampled. Therefore, there is uncertainty in the estimates of the risk posed by extratropical cyclones and their associated wind hazards.
As a result, there is a need to continue improving our understanding of extreme weather systems and their potential impacts in order to develop more accurate and reliable risk assessments for the future.
Through the WTW Research Network’s long running partnership with the University of Exeter, our researchers have developed a method to estimate extreme windstorm gust speed return levels from a multi-year sample of observed windstorm footprints. Their method is straightforward and transparent, providing a new and complimentary approach to traditional catastrophe models, helping insurers and other industries enhance their understanding of tail risk. Their work has been recently published in the Natural Hazards and Earth Systems Sciences (NHESS) journal (Priestley et al., 2023).
Read on to discover how to estimate the 200-year return level for European winter windstorms, and the critical role of the North Atlantic Oscillation (NAO) in modulating the likelihood of future extreme windstorm gust speed events.
The North Atlantic Oscillation (NAO) is a significant atmospheric pressure pattern in the North Atlantic Ocean region that affects the weather in Europe. The NAO describes changes in the pressure gradient across the North Atlantic Ocean from the Azores archipelago to Iceland (see Figure 1).

Source: Schematic adapted from Climate Variability: North Atlantic Oscillation
The positive NAO phase represents a stronger-than-average pressure difference between the Azores and Iceland. This leads to stronger winds from the west, which bring warmer air and stronger storms affecting north Europe with mild, wet, and stormy winter conditions.
The reverse of the positive phase, the negative NAO represents a weaker atmospheric pressure difference between the Azores and Iceland. This preconditions winds to more likely blow from the east and north-east, with weaker and less frequent storms. As a result, northern Europe experiences colder, calmer, and drier winters under negative NAO.
Understanding the phase of the NAO is crucial as it helps predict and anticipate changes in regional weather patterns, and winter conditions, across Europe. This information can assist in planning and preparation for potential weather-related events and subsequent impacts on society.
The NAO can vary widely from week to week, season to season, and year to year, but since the 1970s it has generally shown a tendency towards a more positive phase, particularly over the winter months (Figure 2). This means that the atmospheric pressure is higher than normal over the Azores and lower than normal over Iceland. This change has led to an increase in storminess over Europe as the stronger westerly winds bring more moisture and storms to the continent. Recent estimates of the historical trend of the NAO have been upwards at a rate of +0.15 standard deviations per decade (1950 – 2020; Blackport & Fyfe, 2022). It is expected that positive NAO states will become more frequent in the future (Fabiano et al., 2021), although the exact trend is unclear.
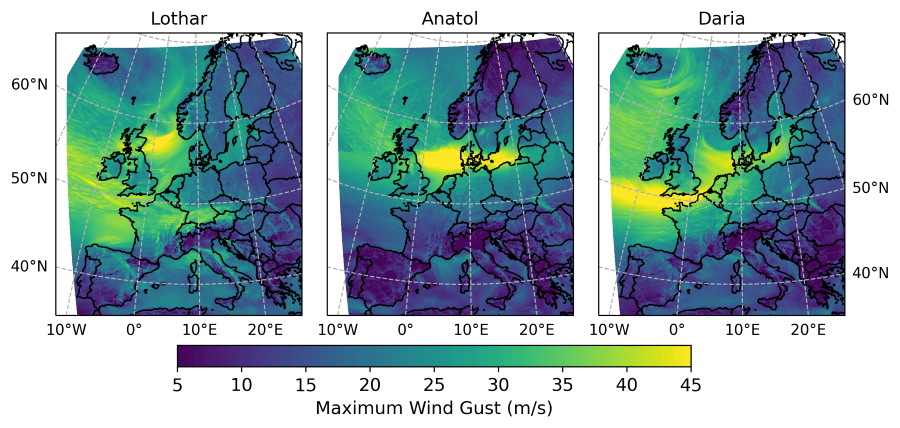
When severe windstorms occur, they leave behind a unique footprint in the wind field, which can be a valuable source of information about their characteristics. These footprints are maps that display the maximum wind gust speed over a specific period of time (usually 72 hours), and analysing them can provide insights into the intensity and direction of the storm. By studying windstorm footprints, we can enhance our understanding of windstorms and develop effective strategies to predict and mitigate their impacts on society.
The Windstorm Information Service (WISC) project (WISC, 2017) offers a collection of validated and spatially coherent footprints for 124 historical events that vary in severity. The WISC footprints span from 1950-2014 and have a spatial resolution of 4.4km. For each storm, the footprints depict the maximum 3-second gusts at a height of 10 meters. Three examples of windstorm footprints for extratropical storms Lothar, Anatol, and Daria are shown in Figure 3.
Using statistical methods WTW Research Network Fellow Dr Matthew Priestley, guided by Professors David Stephenson and Adam Scaife, has developed a novel model for estimating wind gusts across Europe up to the 200-year return period with a resolution of 4.4 km. Unlike most hazard event sets, this model uses observed windstorm footprints from the WISC project as an input and is flexible to allow for varying amounts of input data to test the sensitivity of estimated return levels to catalogue length. This is important since short records, or those models calibrated against limited data, make it difficult to identify trends or gust severity given that extreme events are associated with high natural variability. Therefore, as the NAO is the leading driver of weather variability across Europe, they have also been able to include historical variations of the NAO in the model. This allows for the historical and projected return level estimates to vary with the phase of the NAO.
Through this approach, the paper answers the following four key questions:
Can 200-year return level gust speeds from European windstorms be estimated using openly available data?
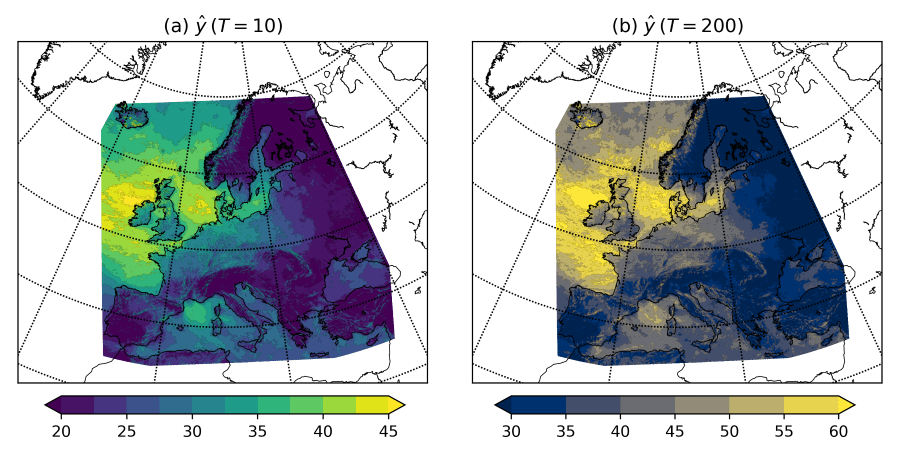
Using the WISC footprints as an input, the study finds that the overall maximum in return levels is across north-western Europe and the North Atlantic Ocean, with the largest 200-year return levels exceeding 60 ms-1 northwest of Ireland (Figure 4). The return levels generally decrease radially from the UK, with lower values across Iberia, Italy, eastern Scandinavia, and eastern/south-eastern Europe. The 200-year return levels over land exceed 40 ms-1 over most of north-western Europe.
How does the NAO affect the strength of European windstorms and their associated gust speeds?
The study reveals that the NAO exhibits a positive relationship with wind gust thresholds in north-western Europe, while its impact in eastern and southern Europe is negligible. Regarding gust speed return levels, the NAO plays a significant role in establishing the threshold but does not show a detectable, noteworthy influence on windstorm gust excesses. Consequently, the significance of the NAO in estimated windstorm return levels diminishes as the return periods become longer. While this study primarily focuses on the NAO's effect on individual storm events, it is worth mentioning that the NAO may also contribute to increased event clustering, potentially leading to higher annual aggregate losses for insurers (Mailier et al., 2006; Walz et al., 2018). However, exploring this relationship extensively was beyond the scope of this study.
How does the length of the historical record, and choice of period, influence the estimates of return level gust speeds?
One factor that can contribute to significant uncertainty in the estimation of return levels is the length of the historical catalogue and the period which is sampled. Choice in record length and period are particularly important for European windstorms due their pronounced decadal variability in storm numbers and losses. The study tests the amount of historical data required to minimise errors in the return level estimation. The results show that the accuracy of windstorm return level estimates can be affected by the amount of windstorm data available (i.e., the length of the historical observations). The study finds that at least 20 years of data is required to get the best estimates of the 200-year return level. However, using only observational data, it is still difficult to quantify the impact of longer historical catalogues on the accuracy of the estimate beyond 40 years.
What impact could future changes in the NAO have on return level gust speeds?
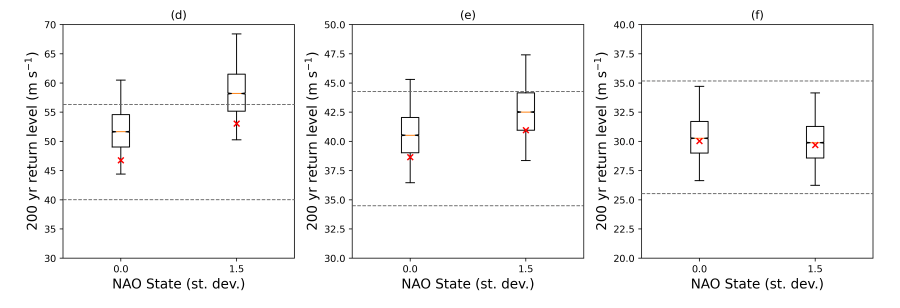
The study simulates the return levels of two different theoretical NAO states (neutral and positive) at three locations across Europe (Bergen, London, and Madrid). The results show that if the historical trend towards a positive NAO were to theoretically continue (at a rate of +0.15 standard deviations per decade), then the 200-year return levels for north-western Europe would likely be unprecedented (approximately 10% higher than historically, Figure 5). For southern Europe, the NAO influence is smaller so that any changes in return levels are not significant compared to the historical uncertainty. Therefore, theoretical a future NAO state (+1.5) would result in considerably higher gusts and impacts than those currently considered, thus highlighting the importance of considering the potential effects of future NAO states in risk assessments. This highlights, additionally, that models which assume a stationary historical climate are also likely to be positively biased relative to actual return levels.
Winter windstorms can have a significant impact on industries and communities across Europe. Accurate assessments of windstorm risk are essential for informed decision making and effective preparedness. However, there is uncertainty in tail risk for European windstorms given the short historical record which is available.
Priestley et al. (2023) presents a novel and transparent solution to this problem, with a new method for estimating high return period wind gusts across Europe. This approach accounts for the complex impact of the NAO on windstorms and their footprints, providing an alternative assessment of windstorm risk. Therefore, this new model can help insurers with an additional perspective for evaluating and developing their view of European windstorm risk. Furthermore, regardless of their status as licensed products, hazard event sets in catastrophe models employ undisclosed hazard curves and calibration methods, thereby hindering transparency and accessibility beyond the risk community. Therefore, this method, developed by the University of Exeter, also provides a new approach for other industries and government agencies that do not use catastrophe model for better understanding and managing windstorm risk.
By unlocking the role of the NAO in driving the magnitude and spatial variability of extreme wind gusts, this approach has the potential to inform seasonal and sub-seasonal scale predictions and better quantify uncertainty relating to longer-term trends and future changes under different scenarios. This information could prove critical in addressing the projected increase in European storminess at the end of the century (e.g., Priestley & Catto, 2022). Furthermore, the method is easily adaptable to other hazards and risks, serving as a framework for assessing extreme events across a range of perils.
It is important to note that continued research in this field is essential for better preparing for, and mitigating, the consequences of European winter windstorms. By providing a more accurate assessment of windstorm risk, such research will help organisations better protect people, communities, and economies from the damaging effects of these extreme weather events. The study by Priestley et al. (2023) is a significant step in this direction, offering a transparent method for investigating and quantifying a range of natural hazards.