Those impacted by the hyperactive North Atlantic hurricane seasons of 2020 and 2021 will see this year’s El Niño as a welcome development. El Niño has historically suppressed hurricane seasons by driving strong winds aloft over the North Atlantic that can tear nascent hurricanes apart.
The prolonged string of three successive seasons of La Niña conditions just ended. Since early this year the warm waters that were piled up over the Western Equatorial Pacific Ocean have slipped back East. Ocean surface temperatures rose at a remarkable pace in the Central and Eastern Equatorial Pacific Ocean (Figure 1), and this is backed by warmth throughout the underlying upper layers of the ocean. These temperatures passed a key threshold triggering the U.S. National Oceanic and Atmospheric Administration to declare an El Niño on June 8.
Meanwhile, over in the North Atlantic surface waters have been warming rapidly. The subtropical high- pressure system has been unusually weak this year, limiting the cooling easterly winds across the tropical North Atlantic. In response, the typical seasonal warming of the North Atlantic has occurred at a rapid pace and parts of the tropical Atlantic are now breaking June temperature records[1] (Figure 1).
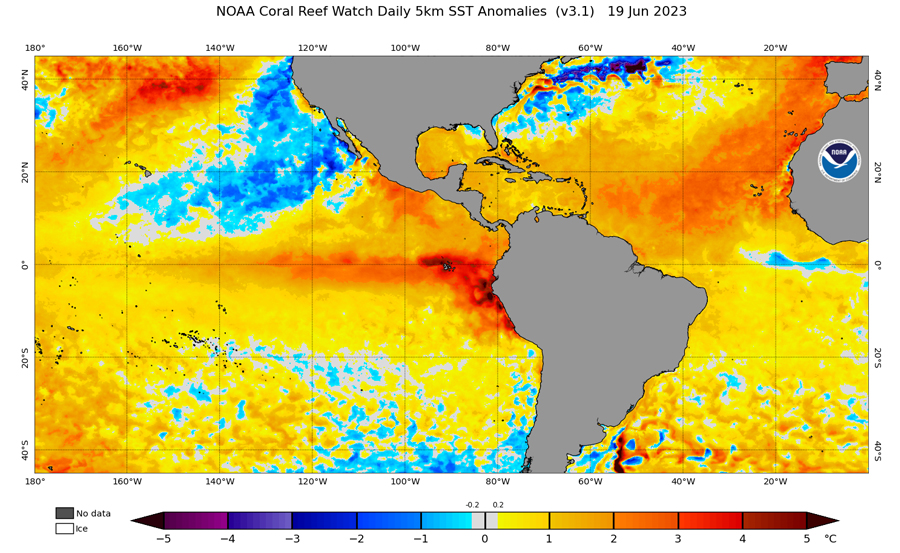
Source: U.S. National Oceanic and Atmospheric Administration Coral Reef Watch
Rather ominously, waters are hotter than they were in June 2005 before the devastating 2005 hurricane season. The Atlantic is poised to break more monthly temperature records during the upcoming hurricane season. Given that hurricanes get their energy from the ocean, this unprecedented warmth will fuel any hurricane that can avoid El Niño’s strong winds aloft.
This year’s combination of expected moderate-to- strong El Niño and Atlantic Ocean warmth falls at the edge of historical experience (Figure 2).
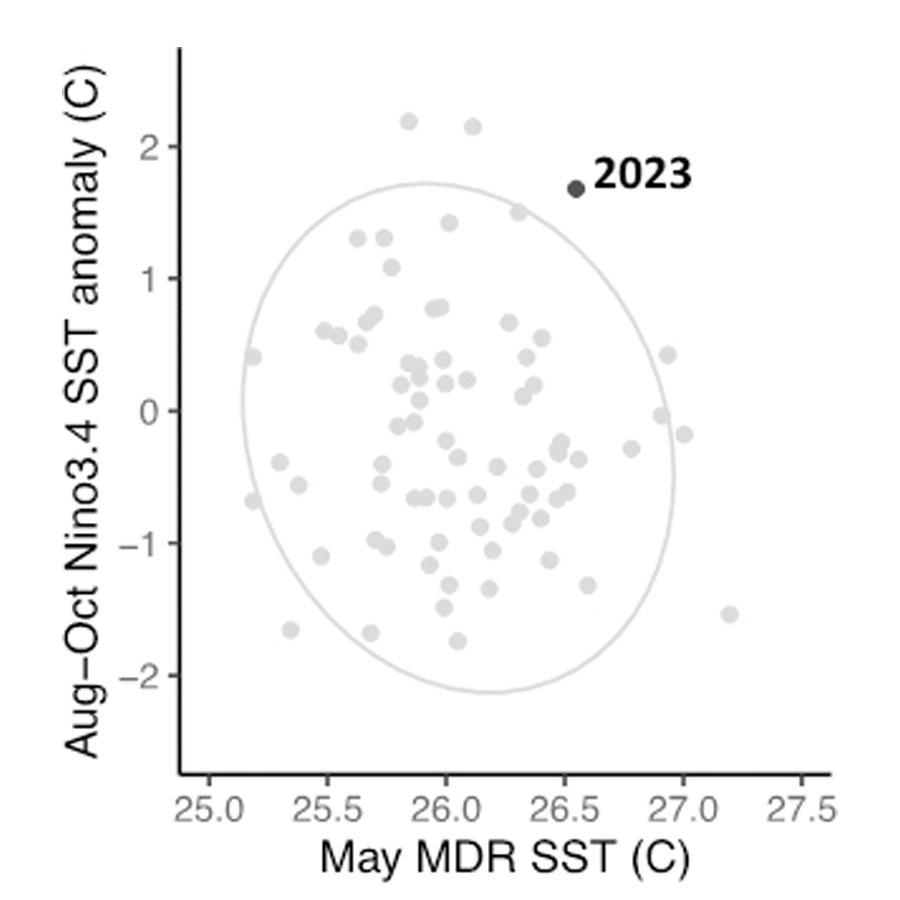
SST was calculated using the National Centers for Environmental Prediction (NCEP) reanalysis. The Nino3.4 SST anomaly is relative to the 1991-2020 average, from the National Oceanic Prediction Centre (NOAA)/Climate Prediction Centre (CPC). For 2023, the Nino3.4 anomaly is the dynamical model average forecast issued on June 16, 2023. [2]
Data source: National Oceanic Prediction Centre (NOAA)/Climate Prediction Centre (CPC)
These two opposing factors for the 2023 hurricane season have led to differing opinions among the major forecasting centers. Those that think the hostile winds brought by El Niño will win out are calling for below normal activity, while those that think the Atlantic Ocean warmth will overcome El Niño’s winds are calling for above normal activity.
Forecasts from universities, government agencies, private companies, and other organizations[3] range from 11 to 28 named storms. The forecasts for hurricanes range from 5 to 15 and major hurricanes from 2 to 7.
11 to 28 named storms 14.4 average
5 to 15 hurricanes 7.2 average
2 to 7 major hurricanes 3.2 average
These predictions extend above and below the 1991-2020 average of 14.4 named storms, 7.2 hurricanes, and 3.2 major hurricanes. This wide range reflects the uncertainty in the opposing forces for this year’s hurricane season. And if that spread wasn’t challenging enough, enter climate change.
A key question that scientists are currently trying to answer is whether El Niño events in today’s climate will suppress hurricane seasons as effectively as they once did. Those strong winds typical of El Niño depend on ocean temperature differences around the global tropics.
Given that all oceans are warming, an El Niño today may not have the same influence as an El Niño in the past. Global ocean surface temperature reached record levels in April[4], making this year a test of the influence of El Niño in a warming world.