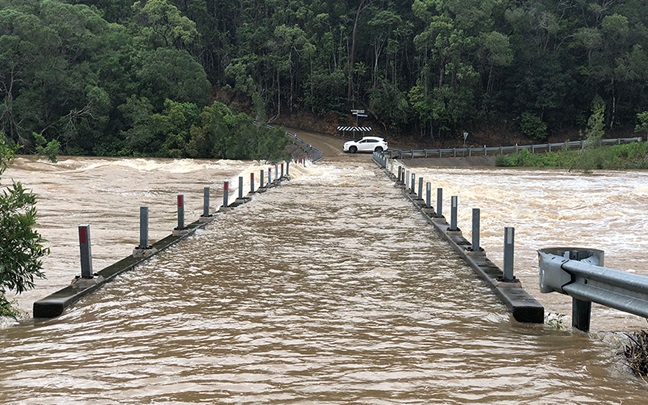
This study explores whether exposure to flood disasters can prompt communities to take action to reduce these risks.
In the United States, safeguarding your property against floods requires a separate insurance policy, distinct from standard homeowners insurance. Until 2020, the vast majority of flood insurance policies are furnished by the National Flood Insurance Program (NFIP), a program established in 1968 and overseen by the Federal Emergency Management Agency (FEMA). This initiative extends flood insurance coverage to homeowners, renters, and business proprietors in participating communities nationwide. A community, in NFIP terms, can be a county, city, or town. Currently, a whopping 22,000 communities actively engage in the program, providing coverage for the majority of the U.S. population.
Each participating community plays a pivotal role in the NFIP by adopting the Flood Insurance Rate Map (FIRM), which outlines the Special Flood Hazard Areas (SFHAs), commonly known as 100-year floodplains. It is mandatory for homeowners situated in SFHAs with federally-backed mortgages to carry flood insurance. The NFIP is not merely an insurance provider; it actively promotes floodplain management and encourages various flood preparedness and mitigation activities at the community level.
Communities seeking NFIP enrollment must adhere to a set of minimum floodplain management standards. These standards encompass requirements such as obtaining permits for development in the SFHA, enforcing a minimum elevation for the lowest floor of new residential buildings within the SFHA, and restricting development in the regulatory floodway.
Despite the insurance obligations for SFHA residences, the average flood insurance penetration rate in these areas hovers around 30%. To incentivize risk reduction and flood preparedness, FEMA introduced the Community Rating System (CRS) in 1990. This system offers discounts to NFIP policyholders based on their community's active involvement in a comprehensive set of risk mitigation and flood preparedness activities beyond the minimum NFIP standards.
Community Rating System, a part of the National Flood Insurance Program, allocates points for activities in four categories: Public Information, Mapping and Regulations, Flood Damage Reduction, and Warning and Response. Higher-effort activities like Acquisition and Relocation receive more points. Communities show varying engagement levels across activities, scoring high in Map Information Service but lower in Flood Protection, despite more points are possible for the latter.
CRS points lead to discounts ranging from 5% to 45% for policies in SFHAs and 5% to 10% for lower-risk flood zones. To qualify for the minimum discount, a community needs 500 points. Most communities fall in the 5-15% discount range, with rare cases exceeding 25%. Communities with higher discounts undergo more frequent verifications.
CRS points lead to discounts ranging from ;
5% to 45% for policies in SFHAs.
5% to 10% for lower-risk flood zones.
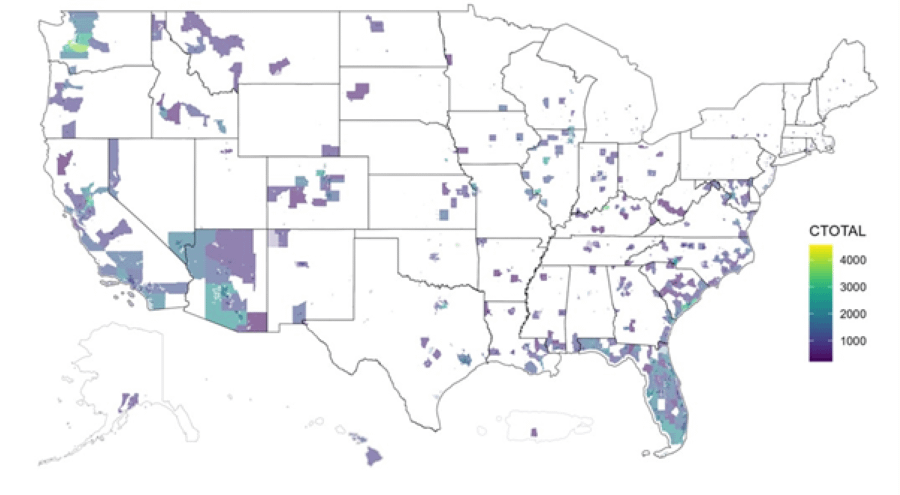
As of June 2021, 1,520 communities participate in the CRS. While constituting a small fraction of all NFIP communities, these engaged communities tend to be more populous and face elevated flood risk, collectively representing over 70% of NFIP policies. Coastal communities in the Southeastern United States, notably Florida, boast particularly high participation rates. This voluntary engagement in the CRS reflects a commitment to enhanced resilience and underscores the vital role communities play in fortifying themselves against the ever-present threat of floods.
The CRS operates on a comprehensive framework, allocating points across four distinct categories of activities:
| Public information series (300) | Mapping and regulations (400) |
|---|---|
| Elevation certificates (310) | Floodplain mapping (410) |
| Map information service (320) | Open space preservation (420) |
| Outreach projects (330) | Higher regulatory standards (430) |
| Hazard disclosure (340) | Flood data management (440) |
| Flood protection information (350) | Stormwater management (450) |
| Flood protection assistance (360) | |
| Flood damage reduction (500) | Warning and response (600) |
| Floodplain management planning (510) | Flood warning and response (610) |
| Acquisition and relocation (520) | Levees (620) |
| Flood protection (530) | Dams (630) |
| Drainage system maintenance (540) |
Examining community engagement across activities reveals varying levels of participation. In 2019, for instance, communities scored 107 out of 140 possible points for Map Information Service (320), while scoring only 12 for Flood Protection (530), despite a potential 2,800 points being attainable in this category.
107 out of 140 possible points scored for for Map Information Service (320)
12 for Flood Protection (530)
In this analysis, CRS points serve as a proxy for communities' risk mitigation efforts.
The estimation dataset covers NFIP communities from 1998 to 2019[1], integrating CRS scores, flood events, and socioeconomic data. CRS records were obtained from FEMA through FOIA requests. To ensure consistency, we harmonized scores from different CRS scoring systems and created a balanced panel.
In gauging the flood exposure of communities, our metric revolves around insured flood losses per capita, computed by county and year based on claim-level data from the FIMA NFIP Redacted Claims dataset from OpenFEMA. To identify significant flood events for a county in a specific year, we designate instances where the per capita flood claim amount ranks in the top 5% of all county-year observations—effectively surpassing a threshold of $3 per 1,000 people.
To account for dynamic economic conditions, we also incorporate key economic indicators at the county-by-year level, including per capita income data from the Bureau of Economic Analysis and unemployment rates from the Bureau of Labor Statistics.
Last but not least, to examine the economic underpinnings that drive communities to engage in risk-mitigation activities, we also incorporate the 2013 Rural-Urban Continuum Codes (RUCC) by the USDA. The RUCC classifies each county as metropolitan or non-metro based on urban population and adjacency.Using this measure, we investigate how rural and urban communities respond to flooding differently in their subsequent risk mitigation activities.
Our findings indicate that flood experience strongly motivates communities to engage in increased flood mitigation and preparedness activities. Having an additional flood event is associated with an average increase of 22.5 points in the overall CRS score, equivalent to 43% of the sample mean. This increase is driven by both a greater propensity for the communities to participate in the CRS and also an increase in engagement level for those already participating. Interestingly, the trend before the flood event appears to be flat, suggesting there is no anticipation or differential participation in communities leading up to the event. Notably, the dynamic effect experiences a significant jump of approximately 15 points in the first year following the event, followed by a gradual and slower-paced increase over the 10-year post-event period, reaching to more than 60 points by the tenth year.
In addition, we find that metropolitan communities are much more responsive in their risk mitigation investments following a flood than non-metro ones. The increase in their probability to participate is more than double that of their non-metro counterparts, and – among those already participating in the CRS – only metro communities ramped up their activity level. These differences manifest across activities of various types and nature, encompassing Higher Regulatory Standards, Warning and Response, Storm Water Management and more, which highlights metro communities’ advantages across multiple dimensions including planning, management, technology, and infrastructure.
As we navigate an era of increasing climate challenges, understanding how communities respond and adapt to natural disasters with increasing frequency and intensity becomes paramount for policymaking to facilitate effective disaster response and enhance community resilience and long-term well-being.