
Get the perspective you need with powerful HR analytics
With moves to more agile forms of employee listening, people analytics teams need simple ways to house all types of employee survey data in one place, so it can be mined for critical insights and analyzed next to critical business metrics. They also want to link their survey results with the wealth of demographic and HR data held in their HRIS systems. This has been a challenge – until now.
Now, with Advanced Analytics for Engage, you can stop grappling with spreadsheets, analytics tools and databases and, instead, easily get the perspective you need.
Answer your toughest talent questions
With Advanced Analytics for Engage, go beyond simple descriptive statistics and answer the tough questions keeping you, your leaders and managers up at night with advanced people analytics.
- Where in our employee hierarchy are the hot spots?
- Are there employees that feel excluded from the process?
- What’s driving customer satisfaction or high revenue growth?
- What is the impact of our onboarding program?
- What’s behind the turnover of our senior executives?
- How does the employee experience change as our people go through various career and life stages?
“Best feature about Engage is the analytics. The platform is easy to navigate and user experience is at the top of their priority. Highly recommended for engagement experts like me.”
April T | Sr. Officer, Employee Engagement
Enterprise organization (> 1000 employees)
Advanced people analytics at the touch of a button
The simple interface and data visualizations of Engage allow you to quickly find answers you can only get by integrating your employee survey data with your HRIS and business data in our Advanced Analytics app.

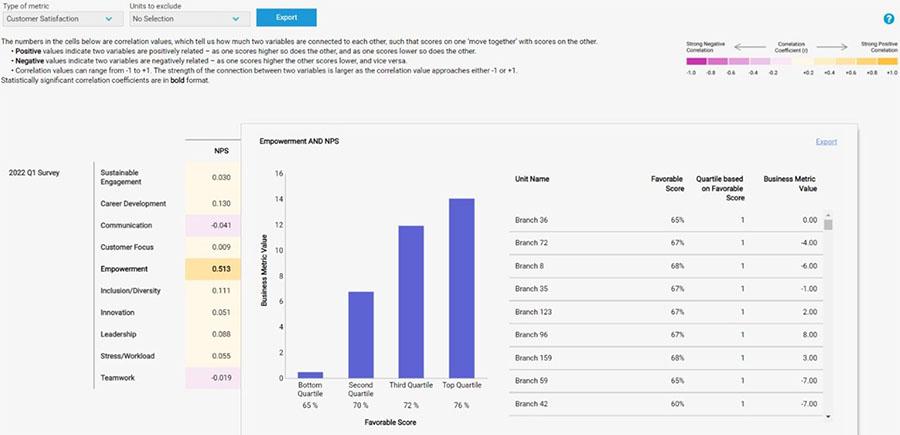
Uncover what drives business KPIs including financial, operational and customer metrics.
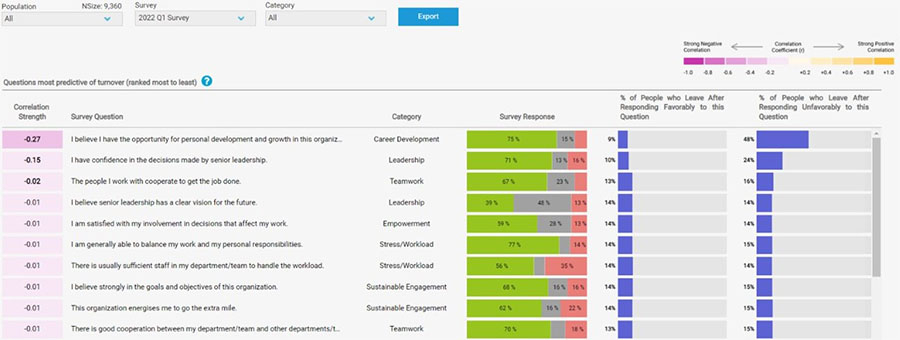
Uncover the most important drivers of actual employee turnover for your entire population or a specific group.
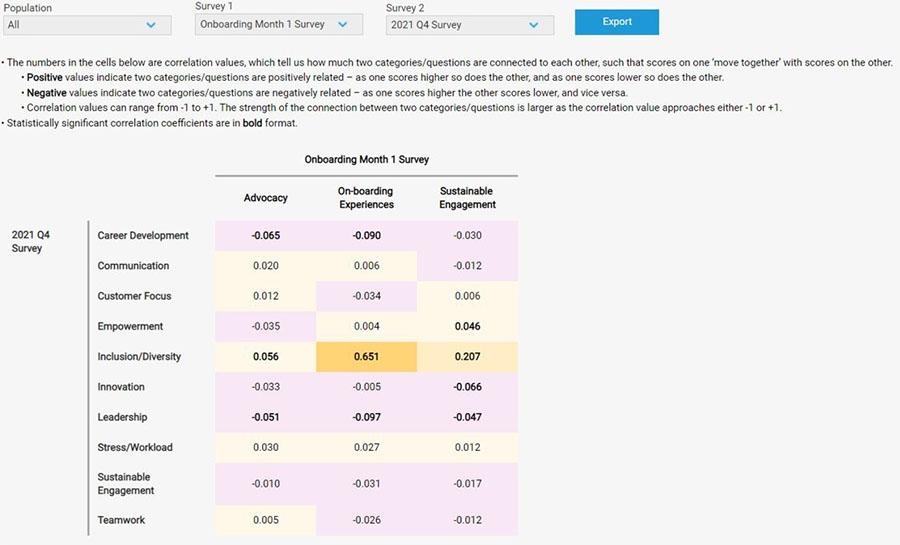
Understand the relationship between questions and categories within an employee survey or across two different surveys. Prioritize where to focus to have maximum impact on the outcome you're most interested in.
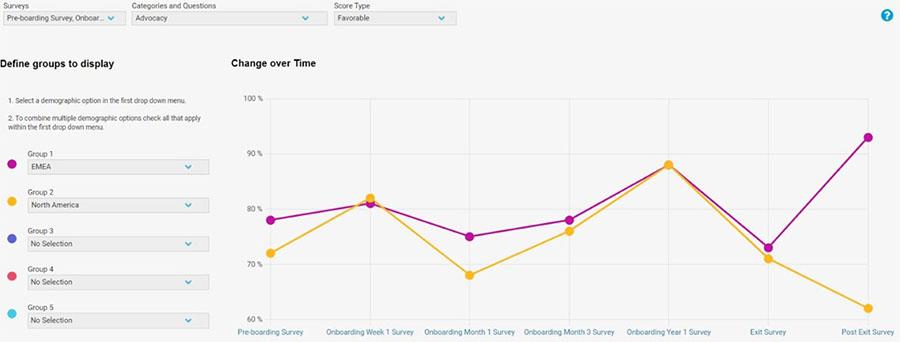
Track defined cohort groups over time and across multiple surveys. Define unique groups based on survey demographic and HRIS variables.
Transform your toughest challenges into actionable opportunities with perspective that moves you. Discover Advanced Analytics for Engage.
