Correct estimation of financial exposure is crucial for the determination of premium and insurance coverage. However, exposure is versatile, challenging to quantify, and often subject to individual subjective assessment. A typical figure estimated in relation to an insurer’s financial exposure is estimated losses in different scenarios. The insurer uses estimated losses to understand the level of premium that can be obtained with the likely extent of loss, and allow the insurer to optimise their net retentions by keeping as much premium as possible for their own account before the use of re-insurance. At the same time, it is essential to emphasise that the magnitude of consequences following inaccurate calculations of exposure can have severe implications for the insurer.
Despite the importance for the insurer to make an appropriate analysis of the risk and determine the potential financial exposure in property insurance, there is no common shared standard for loss estimation in the insurance industry. The industry uses a spectrum of subjective definitions and methods to determine expected loss potentials that overlap in their notions and definitions. The competitive nature of the industry and an unwillingness to share detailed information about exposure models make an accurate presentation of tools and comparison of methods challenging. However, it is reasonable to argue that policyholders who seek insurance coverage would benefit from a better understanding and standardized approach, allowing an easier understanding of the composition of the premium offered to them.
The known literature clearly shows that the challenge of comparing how exposure is calculated begins with the definitions and guidelines for models themselves. While there are many ways of estimating and presenting property risk exposure in the industry, there are nine commonly used definitions: NLE (Normal Loss Expectancy), MFL (Maximum Foreseeable Loss), EML (Estimated Maximum Loss), PML (Probable Maximum Loss), MCL (Maximum Credible Loss), MAS (Maximum Amount Subject), PML (Possible Maximum Loss), MPL (Maximum Possible Loss) and CL (Catastrophic Loss).
To illustrate the variation in terminology and methodology the insurer’s exposure to fire is used as an example here. In the case of fire exposure modelling, the nine different definitions vary in the degree to which three different main parameters – Fire Protection Systems, Fire Fighting and Structural Separation – are assumed to mitigate potential loss. The parameter Fire Protection Systems entails all technological measures expected to mitigate the growth of the fire, including fire-resisting doors, the presence and degree of function of the installation of fire detection, and fire extinguishing systems. Fire Fighting includes all public and private firefighting and the expectancy for it to arrive in time and be effective. Structural Separation solely refers to the expectancy that the distance between structures, such as administrative buildings and storage, or free-standing firewalls, prevent the further growth of the fire.
Depending on the degree of damage related to the assessment of the property a loss figure for property damage can be determined. The loss estimations are based on a variety of different information, including geo-information, empirical loss data, site visits by engineers and publicly available and private data; yet, to simplify the understanding loss estimation can – in general terms – be broken down to multiplying the sum to be insured by a percentage damage factor. The percentage damage factor, however, is dependent on the individual assessing the property and can be difficult to determine precisely.
If the methods are compared in a simple matrix, the differences become clear. To illustrate the differences, symbols and colours are used in the figure below to show the effectiveness of measures with the check on green presenting effectiveness, the hourglass on yellow symbolising a delay and the cross on red ineffectiveness of the mitigation measures.
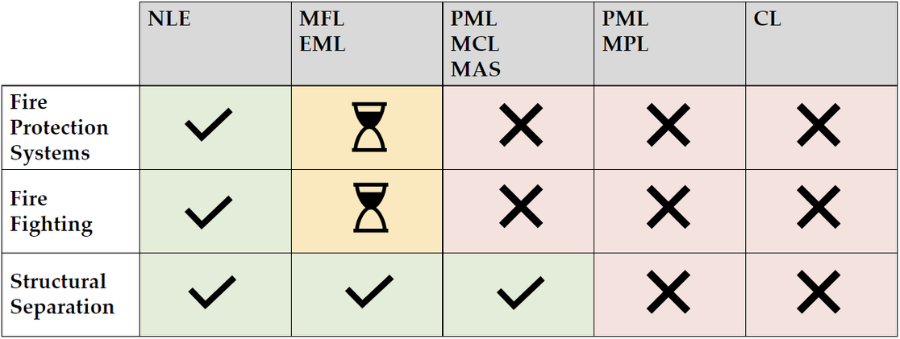
By comparing the nine definitions, it becomes apparent that the main difference between them is forced by the degree of risk aversity chosen by the respective insurer. From left to right, the definitions decrease in risk aversity, with Normal Loss Expectancy (NLE) assuming the lowest damage to property and Catastrophic Loss (CL) the highest.
Industrialization and increase in technical progress have led to a steady increase in business interruption loss that must also be included in the calculations of loss estimation. Damage analyses show that for almost all major property losses there is a business interruption element, which usually accounts for the majority of the total loss. Contrary to the modelling of property damage and related loss, modelling of business interruption and loss of profits lag far behind. In particular, modelling functional relationships that translate property damage into Business Interruption poses a major challenge. Depending on public and private decisions for resilience measures that mitigate losses and maintain a business function to ensure a quick recovery, it is complicated to estimate consequential loss beforehand. An important factor included when considering the insurance sum regarding business interruption is the future development of a company, which is in itself dependent on numerous uncertain factors.
These findings reflect three important trends. First, the currently used models are to an extent subjective in nature and greatly dependent on experience as well as the person who conducts the calculations. Second, as data become more tangible and easier to obtain, the insurance industry should promote the use of uniform models that are objective in the method to quantify the exposure. Third, business interruption is a continuous challenge that, unlike property damage, does not necessarily get fixed by repair or replacement of the damage. Relatively few suggestions on detailed parameters determining the loss of profits due to reputational damage, changes in market share, and further highly complex market behavioural effects can be found in the literature. Still, correct quantification is of great importance to ensure optimal coverage and protection for business interruption.
Future research should focus on organizational resilience and the quantification of risk. It is important to understand how organizations can foster resilience, yet still, be efficient and competitive in their respective markets. A better and quantified understanding of risk will benefit policyholders’ boardroom decisions of risk mitigation and risk transfer under uncertainty.
1 ABI, A. o. B. I. (2021). "About Buildings Insurance." Retrieved 10.10.2021, 2021, from https://abi.bcis.co.uk/about_building_insurance/about.aspx.
2 Ahlert, R. C. (2000). Guidelines for consequence analysis of chemical releases. Center for Chemical Process Safety, American Institute of Chemical Engineers (AIChE), New York, NY,(1999,) 320 Pages,[ISBN No.: 0‐8169‐0786‐2], US. List Price: $129.00, Wiley Online Library.
3 API (2008). Risk-based inspection technology. Washington, American Petroleum Institute.
4 Arunraj, N. S. and J. Maiti (2009). "A methodology for overall consequence modeling in chemical industry." Journal of hazardous materials 169(1): 556-574.
5 Bjørlig, K. and D. E. Penzenstadler (1997). EML or PML - Does It Make A Difference? F. Reichelt. Munich, ERC Frankona Rückversicherungs-AG,.
6 CIA, C. I. A. (1992). "Guidelines on Business Interruption." Risk Assessment in the Chemical Industry August.
7 Eren, C. and H. Luş (2015). "A risk based PML estimation method for single-storey reinforced concrete industrial buildings and its impact on earthquake insurance rates." Bulletin of earthquake engineering 13(7): 2169-2195.
8 Gerathewohl, K. (1983). Reinsurance, Principles and Practice Vol. II, VVW GmbH.
9 Gustavsson, M., et al. (2010). "Evaluating EML Modeling Tools for Insurance Purposes: A Case Study." International Journal of Chemical Engineering 2010(Article ID 104370): 1-13.
10 Hashemi, S. J., et al. (2014). "Loss functions and their applications in process safety assessment." Process safety progress 33(3): 285-291.
11 Hashemi, S. J., et al. (2015). "Probabilistic modeling of business interruption and reputational losses for process facilities." Process safety progress 34(4): 373-382.
12 Hashemi, S. J., et al. (2014). "Risk-based operational performance analysis using loss functions." Chemical Engineering Science 116: 99-108.
13 Heo, J., et al. (2007). "An integrated methodology for estimation of forest fire-loss using geospatial information." Environmental monitoring and assessment 144(1-3): 285-299.
14 IFoA / CAS, I. a. F. o. A. I. P. R. W. P. (2017). Analyzing the Disconnect Between the Reinsurance Submission and Global Underwriters' Needs ‐ Property Per Risk, Institute and Faculty of Actuaries.
15 McGuiness, J. S. (1969). "Is ‘Probable Maximum Loss’ (PML) a useful concept?" Proceedings of the casualty actuarial society LVI.
16 Pula, R., et al. (2006). "A grid based approach for fire and explosion consequence analysis." Process Safety and Environmental Protection 84(2): 79-91.
17 Rigby Smith, C. K. A. M. P. I. I. o. L. (1995). Estimated maximum loss assessments : London Market practice, Insurance Institute of London.
18 ROA, R. O. A. n. L. (1974). Definition of Estimated Maximum Loss. London.
19 Ronken, L. (2020) Avoiding Underinsurance – Why an Accurate Sum Insured Is Vital (but Often Neglected). Poperty Matters
20 Rose, A. and C. K. Huyck (2016). "Improving Catastrophe Modeling for Business Interruption Insurance Needs: Improving Catastrophe Modeling for Business Interruption." Risk analysis 36(10): 1896-1915.
21 Soprano, A. (2009). Measuring operational and reputational risk: a practitioner's approach. Chichester, England;Hoboken, N.J;, Wiley.
22 Sultana, Z., et al. (2018). "Assessment of business interruption of flood-affected companies using random forests." Water (Basel) 10(8): 1049.
23 Yohn, A. (2021) Using geospatial property intelligence & GIS for risk assessment.
The most moderate definition is the Normal Loss Expectancy, which is “the largest loss that is to be expected from a site, excluding all catastrophic events”. In the case of an NLE scenario, all available protective measures function as they should and a fire or explosion is extinguished or controlled by public or private firefighting, as well as structural separation.
Maximum Foreseeable Loss is defined as the “largest loss, excluding a catastrophe loss, which is to be expected at a given site, assuming that the primary protection systems are either impaired or activated only after a delay”. It is assumed that fire damage will be limited only by the structural features of the buildings, such as blank, free-standing firewalls or adequate distances between buildings.
Estimated Maximum Loss is one of the two most commonly used concepts. Generally, the industry finds orientation in a definition of EML proposed in the early seventies by the then-called Reinsurance Offices’ Association (ROA) in London, developed as a standard for reinsurance. Estimated Maximum Loss, as defined by ROA, is “an estimate of the financial loss that is expected to be within the realms of probability, sustained by insurers on a single risk as a result of a single fire or explosion”. Catastrophes and rare coincidences that are believed to be unlikely are excluded in the model. It is apparent that the definition contains a variety of words that allow room for individual interpretation and the inclusion of local experiences and regulations that may vary across the world. However, it also provides a definition of a “single risk” and a list of parameters to be taken into account when calculating the financial loss. Furthermore, it provides an attempt to specify what should be considered within the realms of probability and what should contrary be considered remote or unlikely coincidences and catastrophes. When calculating the EML, one should assume that any automatic fire-alarm and extinguishing systems such as sprinklers, carbon dioxide and foam systems fail to function. Furthermore, the model contains the assumption that any private or public assistance is delayed and at least two connecting fire areas are open. Magnetically operating fire doors should also be assumed to fail at closing. However, fully sealed fire walls do hold in the model, unless they are exposed to exceptionally high fire loads, or an explosion is assumed to be very likely. The respective separation walls, including fire walls, must withstand fire for at least two hours.
In accordance with the Former German Association of Property Insurers and the LIRMA guidelines, the Estimated Maximum Loss (EML) is generally estimated by dividing the risk into complexes. Anything that consists of one or more buildings, rooms, or structures, which contain structural boundaries or separations themselves, can be considered complex. It is not necessary for them to be completely separated from neighbouring buildings or structures. The possibility that a fire may spread beyond the complex in which it starts depends on a list of characteristics or events, including the risk of consequential damage resulting from corrosive gases of vapours, risk of explosion and cases of simultaneous arson in several complexes.
Probable Maximum Loss is the other most used concept with EML. When using PML, underwriters aim for the quantification of consequences following a major fire or explosion, for which the risk’s primary fire-protection, such as automatic sprinkler systems and fire alarms are ineffective. It is often defined as “the largest estimated loss arising from a single event, which was assessed with due care, taking into account all the elements of the risk”.
Like all other estimates, the PML estimate is subject to several uncertainty factors. Both, subjective and objective in nature. Subjective factors can lie in the different opinions on the exposure of a risk assessed by engineers with varying degrees of experience or the desire for more capacity. Objective uncertainty factors are based on technological advancements and on the lack of guarantee in fire development and its confinement to one complex.
Deciding on a uniform definition and the necessity to determine the main parameters to establish a PML has been treated in depth before. As a result, definite guidelines for determining the PML have been introduced in some markets, such as Germany.
Maximum Credible Loss is defined as the “largest monetary loss that can credibly result from a single major occurrence of an insured peril at a specific risk”. Similar to Probable Maximum Loss, it is assumed that neither any fire protection systems, nor firefighting measures are effective, and the fire is only contained by structural separation.
Similarly to the PML and MCL, the Maximum Amount Subject also assumes the containment of fire solely through structural separation. It is defined as “the largest percentage of the total sum insured values (PD and BI) at the location which is subject to fire, including attendant heat, smoke or water damage resulting from the fire, or efforts to extinguish it, plus the cost of debris removal if such is included in the treaty”.
Possible Maximum Loss (PML) or Maximum Possible Loss (MPL) are “the monetary loss which may occur in extraordinary coincidences of the most disadvantageous circumstances with the effect of preventing or impeding fire-fighting measures so that the fire continues to burn until it has exhausted the supply of combustible material or is stopped by impassable obstacles”.
The definition resulting in the highest damage is Catastrophic Loss, an estimate of the loss that will occur at a site as a result of the following types of events:
However, even those events do not include sabotage, natural disasters such as hurricanes or earthquakes, or falling aircraft. No separation is assumed to stop the spread of the explosion or fire.