Statistically, 2022 so far has not been unusual. The season started off early enough with 3 named storms: Alex, Bonnie, and Colin but this year was the first since 2014 without a named storm before the official start of the season on June 1. Early August is when the North Atlantic really starts to light up, with August to October peak season for pulses of energy to track off the coast of North Africa, seeding the Atlantic with opportunities for storm formation. But given the forecasts for a very active season we were not expecting most of July and early August to be silent, which would be unusual even in an average year.
We can look to intra-seasonal variability to explain some of this surprise. A form of climate variability known as the Madden-Julian-Oscillation intermittently races around the global tropics acting to suppress or enhance thunderstorm activity and tropical cyclones as it goes. For most of July its unfavorable phase suppressed storm activity over the North Atlantic. In addition, dry air extended across much of the North Atlantic. These oppressive forces are expected to dissipate in August. If so, we’ll likely see a burst of storm activity in September. The National Oceanic and Atmospheric Administration (NOAA) also notes that activity in June-July is not closely correlated with activity in August-October.
The current situation has signals that the North Atlantic will likely ramp up on schedule. A pulse of energy has just tracked off the coast of North Africa and will become a focal point for possible storm formation over the central tropical North Atlantic over the next few days.
As a reminder, seasonal forecasts are often presented relative to normal activity. But what is normal? Normal activity is defined as the average over a recent 30-year period. Thirty years are long enough to average out climate variability but short enough to avoid including climate change trends. The thirty-year period was recently updated, and we now use the period 1991-2020 to give a more up-to-date version of ‘normal’. With most of this new period being in an active hurricane period, the new normal hurricane activity has shifted upwards to 14.4 named storms, 7.2 hurricanes and 3.2 major hurricanes. Compare that our previous normal activity of 12.1 named storms, 6.4 hurricanes, and 2.7 major hurricanes for the period 1981-2010. This represents an increase in normal activity of about 12-18%.
Available forecasts for early August from the major forecasting centers continue to call for above average activity (Table 1). For example, NOAA forecasts a 60% chance of above normal activity and just a 10% chance of below normal activity. However, these latest forecasts are a decrease of generally 5-20% in activity compared to the early-season forecasts. We note that these forecasts for above average activity are relative to the new higher averages and so these forecasts certainly still call for an active season.
Across all forecasts in Table 1, the number of named storms range from 11 to 21. For hurricanes the numbers fall within a range of 4 to 10, and for major hurricanes (Saffir-Simpson category 3-5) they range from 2 to 6. We note that NOAA and the UK Met Office forecast ranges of activity to reflect uncertainty in the predicted environment and uncertainty in the hurricane activity within that environment. They state a 70% likelihood of the numbers falling within these ranges.
The reasoning behind the continued expectation of an active season includes climate predictions of supportive conditions in the Atlantic basin this season. Specifically, La Niña is expected to persist through the season which would suppress environmental winds aloft that are unfavorable for storm formation. NOAA also notes that the pulses of energy coming off Africa are set to track on a more northerly trajectory than normal which gives more background spin in the atmosphere and is more favorable for storm formation. Sea surface temperatures are forecast to be warmer than normal across the tropical North Atlantic, Caribbean, and Gulf of Mexico. However, CSU notes that cooler-than-normal subtropical North Atlantic waters could set the stage for some disturbed weather that could interfere with storm formation.
CSU continue to forecast higher than normal likelihood of a major hurricane landfall for the continental U.S. and the Caribbean. They forecast a 68% probability of at least one major hurricane landfall for the entire continental US coastline. This compares with the average likelihood of 52%. For the Caribbean they forecast a 57% probability of at least one major hurricane tracking into the Caribbean. Compare this with the average likelihood of 42%.
| Data Source | Date Issued | # Named Storms | # Hurricanes | # Major Hurricanes | ACE1 |
|---|---|---|---|---|---|
| 1991-2020 average (Source NOAA/CPC) | 14.4 | 7.2 | 3.2 | 122.1 | |
| Average of 6 analog years (Source CSU) | Aug 4, 2022 | 16.8 | 7.5 | 4.0 | 142 |
| Colorado State University2 | Aug 4, 2022 | 18 | 8 | 4 | 150 |
| NOAA/CPC2 | Aug 4, 2022 | 14-20 | 6-10 | 3-5 | 110%-190% of the median |
| UK Met Office2 | Aug 2, 2022 | 11-21 | 4-8 | 2-6 | 84-218 |
CSU provides an alternative view to forecast models by using hurricane activity in past years that had similar climate conditions and trends in July as this year and similar forecast conditions for Aug-Oct. CSU’s selected analog years –1999, 2000, 2011, 2021 - are characterized by La Niña conditions in Aug-Oct and close-to-average North Atlantic Sea surface temperatures for the peak of the hurricane season. The average activity among these four analog years is shown in the above table and indicates above normal numbers of named storms, hurricanes, and major hurricanes. Their official forecast is higher than the average of these analog years.
The formation and development of hurricanes is highly dependent on the available energy in the upper layers of the ocean. Therefore, ocean temperatures are often used as a proxy for available energy, and this is a major factor in determining seasonal activity. At the time of early June water temperatures across the tropical North Atlantic were close to normal. Waters have since warmed faster than normal along US coasts (Figure 1 below). Crucially waters have also warmed in the deep tropics, setting up favorable surface conditions for storm formation. However, subtropical regions have been slow to warm and are now cooler than normal.
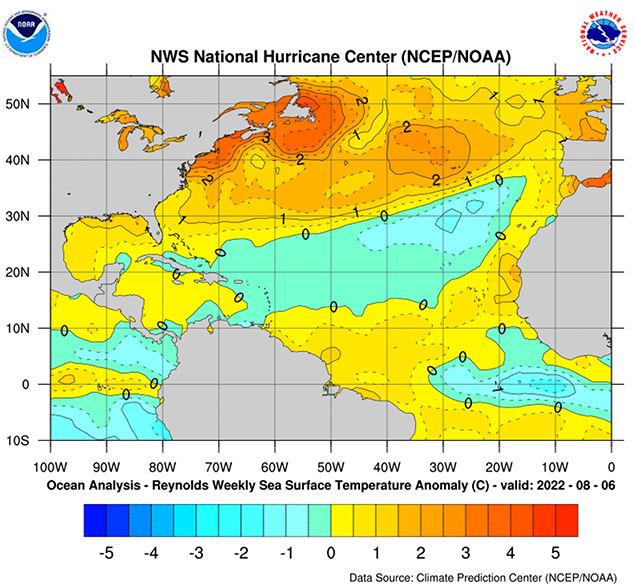
Source: https://www.nhc.noaa.gov/tafb/atl_anom.gif: NCEP/NOAA
Since June, we have monitored hotspots of energy for hurricane intensification in the Gulf of Mexico. As expected, the loop current is still present in the Gulf as shown in the map of ocean currents near the surface (Figure 1, bottom panel). The loop current also extends close to central US Gulf Coast. The loop current is unstable and appears to be close to short circuiting and breaking off a circulating eddy of warm water that will likely persist for the rest of the hurricane season. This eddy will give a boost to any passing hurricane this year.

Source: https://www7320.nrlssc.navy.mil/GLBhycomcice1-12/glfmex.html: U.S. Naval Research Laboratory
The sloshing back and forth of warm water across the equatorial Pacific associated with El Niño Southern Oscillation (ENSO) exerts the strongest known control on Atlantic hurricane activity. The atmosphere responds with rising air following the warm water across the Pacific. In turn, this shifts the entire global overturning circulation.
During La Niña, when warm waters slosh over to the Western Pacific, any hostile winds aloft over the Atlantic tend to dissipate, leaving favorable conditions for hurricane activity.
Since June the Equatorial Pacific Ocean has stayed cool and the atmosphere has remained aligned with the current La Niña conditions. This has been helped by strong winds blowing across the equatorial eastern Pacific and dragging up cooler waters to the surface, thereby sustaining La Niña. However, the strength of the La Niña state has weakened slightly.
Most models sustain a weak-to-moderate La Niña into at least the early winter. The latest forecasts show only a 1% chance of El Niño for the peak of the hurricane season, leaving a 99% chance of La Niña or neutral conditions (Figure 2). Both would favor an active season. The continuation of La Niña would push hurricane activity towards the higher end of the forecast ranges.
This year looks set to be a third consecutive year of La Niña or cool-neutral conditions. We’ve had La Niña for three years in a row only twice before:1973–1976 and 1998–2001.
Forecasts issued in early August contain useful skill, but all seasonal forecasts should be read with caution. They significantly outperform the standard benchmark of the so-called “persistence” forecast (a forecast of average activity every year). The sources of enhanced skill arise from persistence of temperature anomalies in the oceans and the fact we are past the April/May predictability barrier for ENSO. While we fully expect La Nina to persist through the season, remaining uncertainties stem from the timing of switch to more active conditions associated with intra-seasonal variability of environmental conditions, and the response of TCs to these environmental conditions.
The latest forecasts for the 2022 hurricane season continue to all point towards an active season. Things to watch during the peak hurricane season are the shift from unfavorable to favorable environmental conditions, the pulses of energy tracking off the coast of North Africa, and the evolution of hotspot of heat in the Gulf of Mexico associated with the Loop Current.
1 Accumulated Cyclone Energy (ACE) is a combined measure of hurricane intensity, duration, and frequency. ACE is calculated as the sum of the square of the maximum wind speed in each 6-hour period during the life of a tropical cyclone from the time it reaches tropical storm strength (wind speeds ≥ 65 kmph (39 mph)) in units of 104; ACE = 10-4∑v2max, where v is measured in knots.
2 Includes the three named storms that already occurred prior to the forecast issue date.